Visualization of Cadastral survey data for city maps: Difference between revisions
| Line 45: | Line 45: | ||
[[File:Kindhausen_CreateHillShading.PNG]] | [[File:Kindhausen_CreateHillShading.PNG]] | ||
[[File:Hint. | [[File:Hint.jpg]] To see the results better, set '''Exaggeration''' to 8. | ||
[[File:Kindhausen02.PNG]] | [[File:Kindhausen02.PNG]] | ||
==[[http://ocad.com/en.wiki/index.php?title=DEM#Create_Contour_Lines Create Contour Lines]]== | ==[[http://ocad.com/en.wiki/index.php?title=DEM#Create_Contour_Lines Create Contour Lines]]== | ||
Revision as of 12:26, 9 November 2011
Link: http://www.cadastre.ch/internet/cadastre/en/home/topics/avs/structure.html
Open OCAD file
Open the file Symbol Set Amtliche Vermessung.ocd.
Import Kindhausen_dxf.dxf
File:Kindhausen ImportDXFFile.PNG
Check Import INSERT as point object
- -> OK
![]() Select an object with the mouse, to see on which layer it is located. The layer information is based on "DXF-Geobau Layerdefinition" (Swiss standards SN 612'020).
Select an object with the mouse, to see on which layer it is located. The layer information is based on "DXF-Geobau Layerdefinition" (Swiss standards SN 612'020).
Convert imported layer
choose Convert Imported Layer to Symbols from Map menu and Load Basisplan_DXF_Layerstruktur.crt.
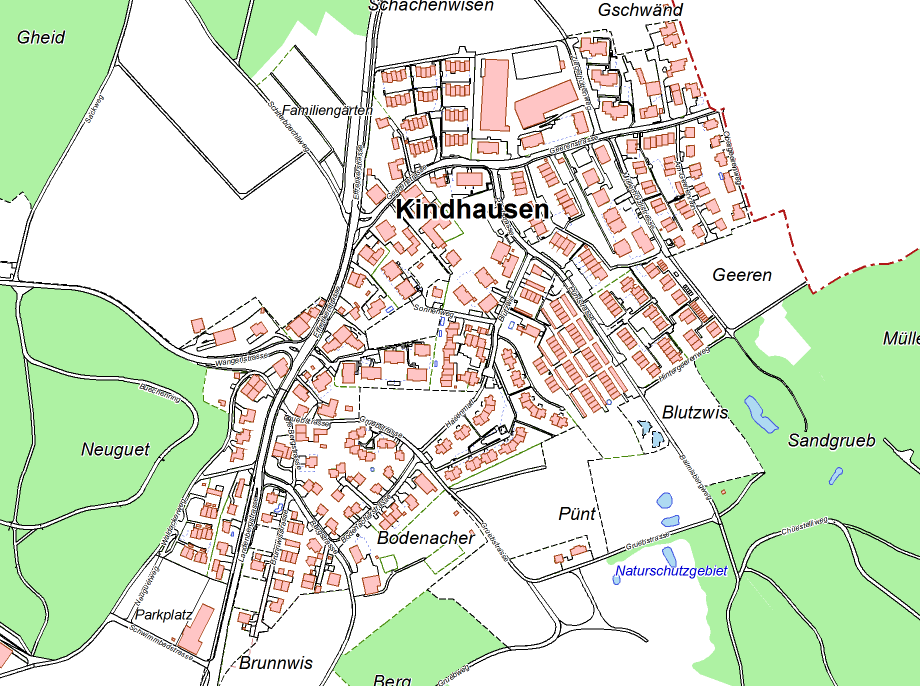
File:Kindhausen ConvertImportedLayerToSymbols.PNG
- -> Execute
DEM Import
choose DEM Import from DEM menu and Add Kindshausen_asci.asc.
- -> Analayze and Save as an ocdDem file.
[Create Hill Shading]
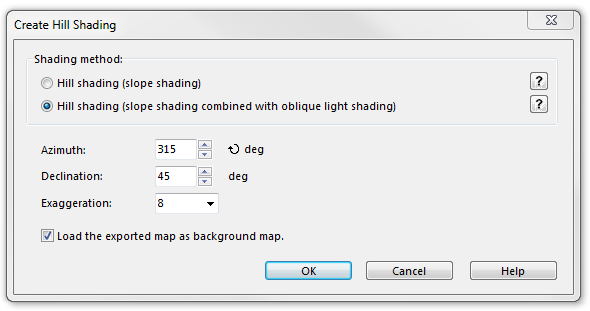
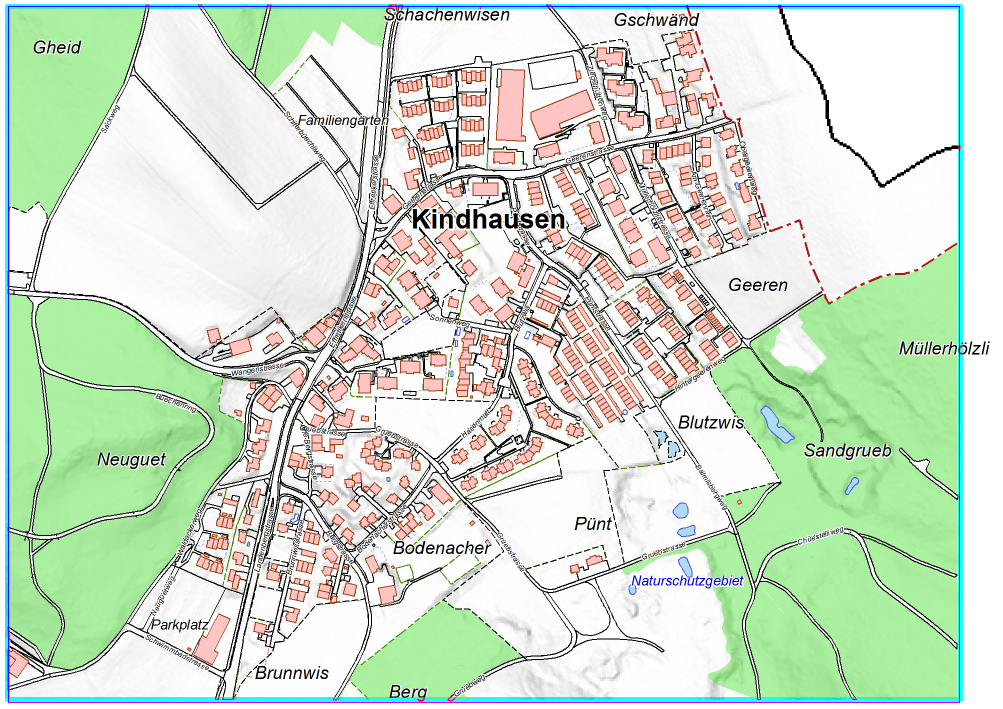
Choose Create Hill Shading from DEM menu. Choose Hill shading (slope shading combined with oblique light shading) and check Load the exported map as backgroundmap.
![]() To see the results better, set Exaggeration to 8.
To see the results better, set Exaggeration to 8.
[Create Contour Lines]
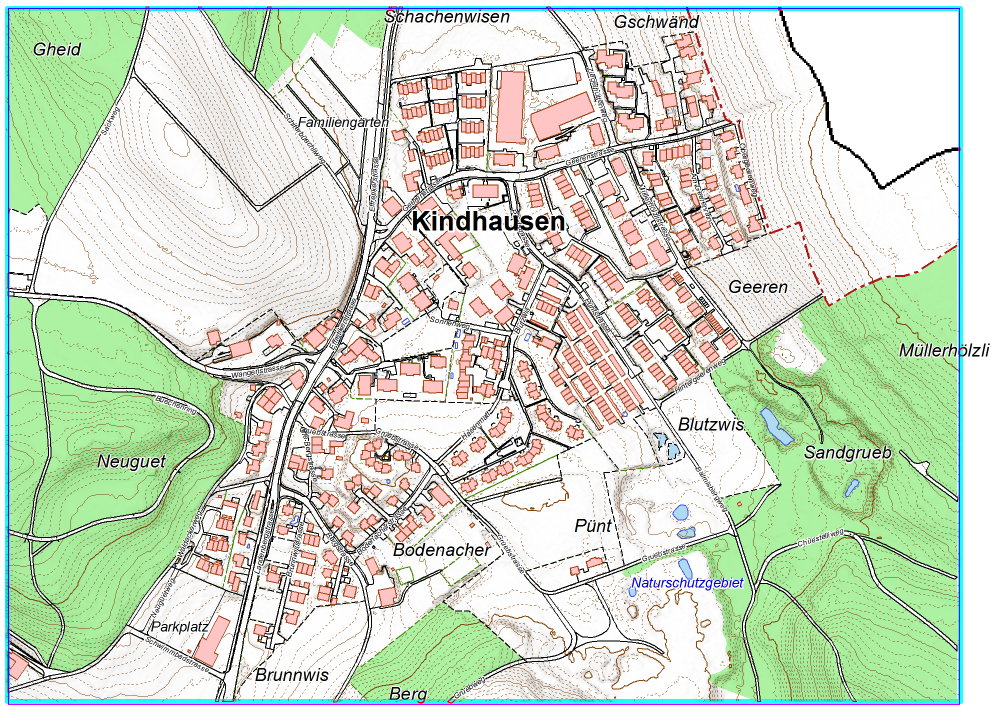
Choose Create Contour Lines from DEM menu. Select desired Contour interval and appropriate line symbols.
- -> OK


