Migration of unstructured DTP maps: Difference between revisions
No edit summary |
|||
| Line 373: | Line 373: | ||
'''Map''' -> '''Set Scale and Coordinate System''' -> '''Choose''' -> '''Coordinate system: UTM''' -> '''Zone: Zone 35 North''' | '''Map''' -> '''Set Scale and Coordinate System''' -> '''Choose''' -> '''Coordinate system: UTM''' -> '''Zone: Zone 35 North''' | ||
''' | '''File''' -> '''Export''' -> '''KMZ Google Earth (Raster)''' | ||
Make export settings and choose map sector: | Make export settings and choose map sector: | ||
| Line 388: | Line 388: | ||
:[[File:Camera.jpg|video available]] [http://www.ocad.com/howtos/125.htm KMZ Google Earth export] | :[[File:Camera.jpg|video available]] [http://www.ocad.com/howtos/125.htm KMZ Google Earth export] | ||
==Appendix== | ==Appendix== | ||
Revision as of 16:11, 4 December 2012
Migration of unstructured Desktop-Publishing Maps into a GIS
A lot of maps are made with a Desktop Publishing (DTP) software like Macromedia Freehand, Adobe Illustrator or CorelDraw. The advantage of these software programs are that they have wide range of drawing and editing tools, a flexible layer structure creating map content and the map layout within one file and has low cost comparing to GIS (Geographic Information System). However, DTP maps are limited in order to keep the state of the art in digital cartography. The main weaknesses are:
- Distortion: DTP maps are often completely or partially distorted due of misplacement of map tiles or vectorization from poorly adjusted background maps. DTP software has no tools to dissolve the distortion according a coordinate reference system or reference points.
- No Georeferencing: DTP Software has no own coordinates reference system to exchange georeference map data. This restricts the use of georeferenced data (e.g. geodata server, geo-portals, and OpenStreetMap data) which is nowadays state of the art either to enhance the map, use the map for navigation or for GPS localization.
- Unstructured map set-up: The flexible layer structure and symbol definitions lead towards maps with a poor set-up. Single map objects are easily moved away from the layer where they should belong in order to achieve a better graphic representation (e.g. bridges and tunnels). Moreover, point features are represented as area features. The result is, that such maps have a lot of redundant data which are on the one side very time consuming to maintain and on the other hand do not fit into GIS properly.
- No specific cartographic drawing and editing tools: DTP Software has no own specific cartographic drawing and software tools to support efficient map production, like line tracing, automatically block out of street intersection or the influencing the dashes of lines.
- No data base connection: DTP Software has no own data base connection to store additional information of map objects like date of capturing, issuer or last editing.
Many map publishers have produced thousands of DTP maps from the start of the cycle of digital cartography. Nowadays, they are worried that they could get stucked in a dead end, because DTP software has obvious weakness or isn’t any more supported.
For that reason, OCAD Inc. developed in collaboration with Huber Cartography, Munich, Germany a workflow with its cartographic software OCAD 10, to save investments in DTP maps by migrating them into its cartographic software or even into a GIS: First, the DTP map must be imported through a PDF file. Then the distortion will be dissolved and the map georeferenced. In a next step, the imported map layer will be converted into a set of symbol, which has been created by the cartographic software. The conversation has the effect that redundant will be removed. Point features which are still represented as area features must be converted into single point features. Now, all map objects can be connected to a data base, which can by edited on the fly. With this workflow the DTP map has been structured in a way that it fits into a GIS environment or could be enhanced with other geodata and maintained with specific cartographic drawing and editing tools in its migrated cartographic software as well. This workflow has been implemented by Huber Cartography successfully.
Read full text: http://www.ocad.com/public/2011-02-11_longTxt_icc2011_migrationDTPmaps_intoGIS.pdf
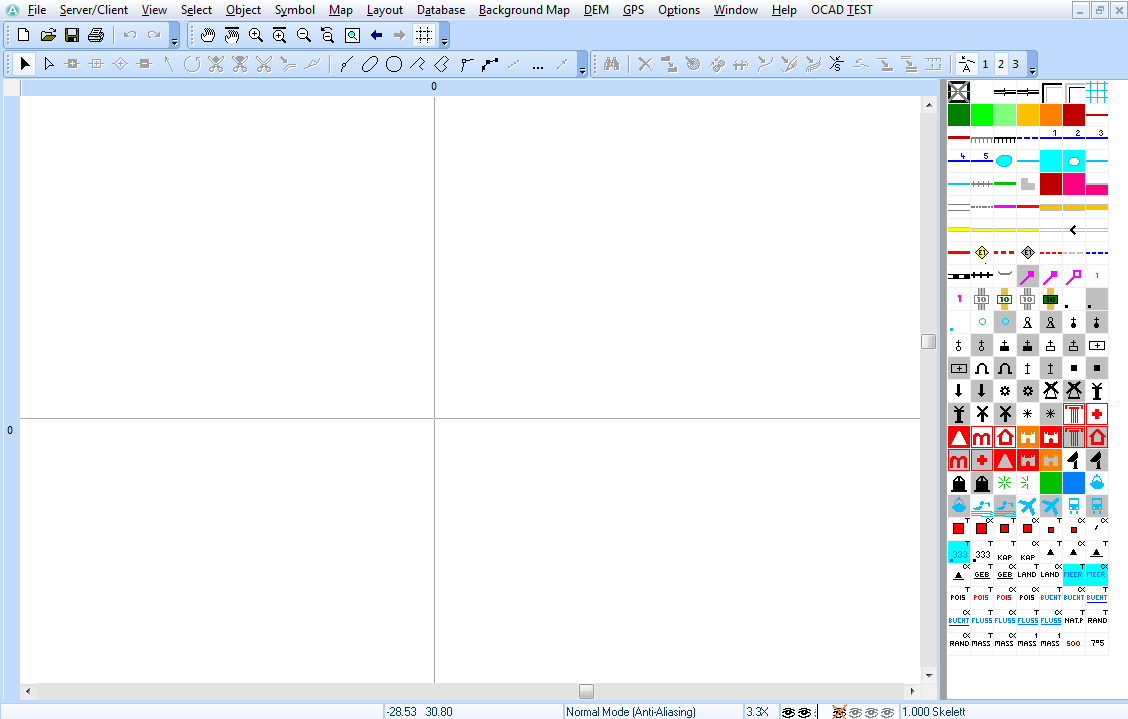
Open OCAD file
Open crete-emty.ocd file. The file is located in the training data in the following directory crete_ocad.
Set Map Scale
Set scale to 1:100 000 (Map -> Set Scale and Coordinate System).
-> OK
Definition of a Symbol Set
In the open OCAD file is already defined a symbol set. Exemplary in this document is the definition of the new point symbol Point of interest is described.
Open scanned legend as background map
Open the TIFF file legende_crete.tif from the directory crete_backgroundmaps as backgroundmap (Backgroundmap -> Open).
Create New Symbol
Symbol -> New
Choose Point Symbol from New Symbol dialog box:
-> OK
Enter symbol number and symbol description. Click the button Edit:
The symbol editor will show.
View -> Hide Show Entire Map and Show Map Grid
In the next step, the legend symbol must be placed into the origin of coordinates of the symbol editor (red arrow in fig):
Background Map -> Adjust (Shortcut F):
- Mouse click Point of Interest in background map.
- Mouse click origin of coordinates from drawing area.
- Execute move with enter key.
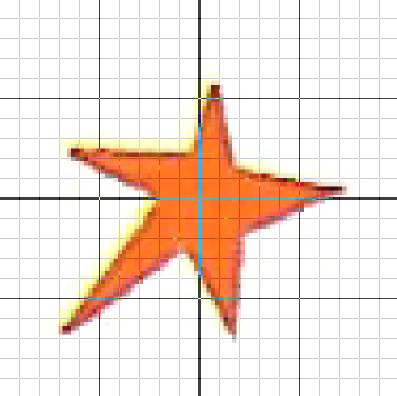
Select the geometry Area and the Color 0: Pikto Orange in symbol editor:
Then just draw the symbol with the straight line mode from the drawing tool.
-> Close symbol editor
The dialog box Point Symbol is shown again.
-> Icon
Create an Icon:
-> OK
The dialog box Point Symbol is shown again.
-> OK
Remove background map (Backgroundmap -> Manage):
-> Remove and Close the dialog
OCAD learning videos:
Import DTP map as PDF
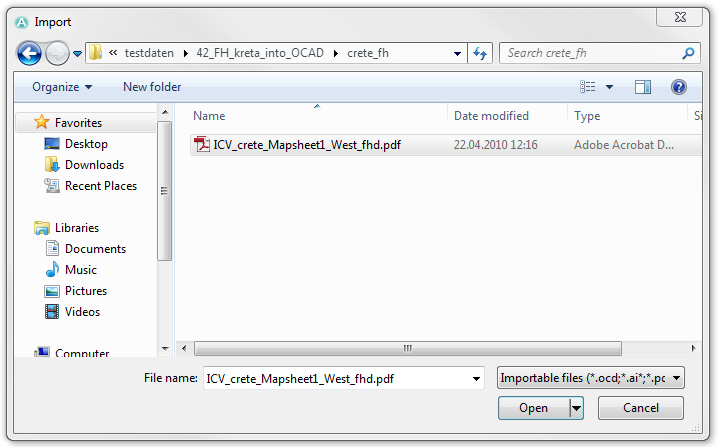
Import PDF file ICV_crete_Mapsheet1_West_fhd.pdf from the directory crete_fh (File -> Import).
-> Open
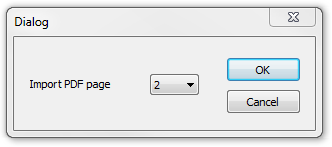
The import side which should be imported must be specified, because it is multi-page PDF.
-> OK
The import map is displayed. However the map is not georeferenced.
Open georeferenced Background Map
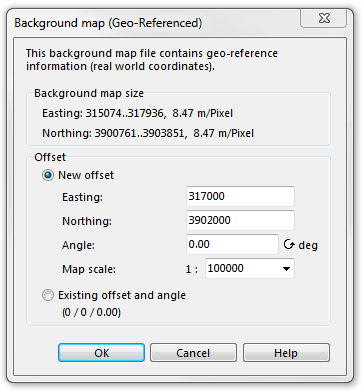
Open the georeferenced TIFF file crete_osm_import_100000.tif from the directory crete_osm as background map (Backgroundmap -> Open).
Because it is a georeferenced background map, a dialog box appears with the question if the new shift (horizontally and vertically according to the Easting and Northing) shall be used as the card center.
-> Ok
The Crete map the the georeferenced background map are shown. But the Crete map is still not correctly georeferenced.
The interactive georeferencing from the Crete map success in the next section.
Georeferencing and Rubbersheeting
Change the View into Draft Mode (View -> Draft Mode).
In the toolbar, a bar appears with two controllers. With the upper controller (M=Map) can adjust the transparency of the map and with the lower controller (B=Background Map) can adjust the transparency of the background map.
Coarse adjustment using Affine transformation
In a first step, the imported map was fitted coarse with an affine transformation in the georeferenced background map (Map -> Transform -> Affine).
- Mouse click into the map.
- Mouse click on the appropriate point on the background map.
- Execute transformation with enter key.
![]() At the affine transformation the maximum of 12 reference points can be defined, by repeating step 1 and 2 until the transformation is triggered by the enter button.
At the affine transformation the maximum of 12 reference points can be defined, by repeating step 1 and 2 until the transformation is triggered by the enter button.
Fine adjustment with Rubbersheeting
In the second step the map fitted as exactly as possible with rubbersheeting transformation on the georeferenced background map (Map -> Transform -> Rubbersheeting)
OCAD learning videos:
First the rubbersheeting perimeter must be determined (Define -> Draw rubbersheeting perimeter on map)
Perimeter is displayed as a blue frame in the drawing area:
When a perimeter is defined, rubbersheeting points can be added interactively or from loaded from a file.
Add rubbersheeting points interactive:
- Mouse click into the map.
- Mouse click on the appropriate point on the background map.
Rubbersheeting points are shown with a red and green crosshair and a blue connection line. In the transformation, the objects moved from the red to the green dot.
Depending on the needs the points can be deactivated, removed or saved. The deactivation is done by mouse click on the first column in the table. Unused points are shown gray in the drawing area.
Execute the transformation by clicking the Transform button.
If the result is satisfactory, the dialogue can be closed.
Otherwise there are the following possibilities:
- Undo the transformation an optimize rubbersheeting points (add, deactivate, delete)
- Use the result as a starting point for further transformation with new points.
Transform PDF image objects in OCAD objects
Automatic conversion
With the function Convert Imported Layers to Symbols (Map -> Convert Imported Layers to Symbols) icons can be automatically converted due to their affiliation with the appropriate symbol into OCAD objects with the appropriate symbol.
In the dialog box Convert Imported Layers to Symbols the translation table crete.crt from the crete_crt directory needs to be loaded.
-> Execute
Manual conversion
In the automatic conversion wrong symbols assigned from objects lying on wrong layers. In the example below, the Greek name of the attraction Tilissos is falsely attributed to the layer with the black instead of red font.
Select object:
Select correct symbol from symbol box:
Click Change Symbol in stadard toolbar to assign the object to the right symbol
Transform area-point objects in OCAD point objects and delete redundant objects
In DTP programms point objects are often defined as an area object. Thus make a situation worse by the map tracking. Therefore, these objects should be converted into point objects. These have only coordinates and can be easily deleted or moved at a tracking.
In the automatic conversion these objects have been transformed as a workaround in area objects (for example 1601.1 chapel area). In the symbol set they are defined as single point and area symbols. First select all objects with the area symbol 1601.1 chapel area (Symbolbox -> symbol 1601.1 chapel area -> context menu -> Select Objects by Symbol).
Then the conversion occur in a point object(Map -> Convert Area or Line Objects to Point Objects), while the symbol 1601.1 chapel area have been selected.
-> Execute
![]() In case of imported signatures, consisting of multiple surfaces, before the conversion the surplus areas have to be removed, so that the equivalent to only one object is created to the appropriate place.
In case of imported signatures, consisting of multiple surfaces, before the conversion the surplus areas have to be removed, so that the equivalent to only one object is created to the appropriate place.
This process is explained using the example of the windmill. The imported windmill signatures are part of five faces: one tower and four rotor blades:
Befor converting into a point object the four rotor blades of all windmills have to be selected and deleted
Select the symbol 1702.1 windmill area in sybmol box.
Choose the function Select Object by Property (Map -> Select Objects by Property).
Settings: Select: Object with a selected symbol Condition: Number of vertices = 4
-> Select and Close dialog box
The rotor blades of all windmills were selected.
Delete selected objects with Delete button.
The ramaining area objects can now be transformed into point objects as described in the first part of the chapter.
Delete redundant objects
There are redundant objects in the immported map. So, for example, streets consist of two or more geometrically identical lines. In OCAD these complex lines can be mapped with a line object. Thus the redundant objects be unnecessary and can be deleted.
First select all objects (Symbol box -> Symbol 1.0 Skelett -> context menu -> Select Objects by Symbol).
Delete selected objects with delete button or .
Attach Database
In OCAD 10 Proffesional is it possible to connect the map or its objects to a database. A new database must be define (Database -> Manage Database Connections)
-> New
Give the connection a name and select the option Use existing datasource
-> OK
Select a database file.
-> Browse
Open the file crete.cls from the directory crete_db.
Select the table wamu§ and the field ID as a key field.
Select all water mills (Symboleditor -> context menu -> Select Objcts by Symobls:
Create database connection für select water mills (Database -> Create and Update Records).
Dataset: Water mills
-> OK
Search the water-mill due to the key field (Find -> enter Key)
->OK
Edit the corresponding database entries in the database box:
Export to a GIS ( SHP or DXF)
The Map or parts thereof can be exported as shape file or DXF and reused in geographical information system or CAD programs.
File -> Export -> Shape -> Point objects -> Objects in dataset: Water mills
-> OK
Save file as crete_wamu.shp
Export for Google Earth (KMZ Google Earth Raster)
The map or parts thereof can also be exported as a KMZ file and reused in Google Earth or GPS device. For this export a coordinate system must be absolutely defined.
Map -> Set Scale and Coordinate System -> Choose -> Coordinate system: UTM -> Zone: Zone 35 North
File -> Export -> KMZ Google Earth (Raster)
Make export settings and choose map sector:
-> OK
Save export file as crete.kmz:
-> Save
Appendix
Settings of the PDF export from Freehand, for the best import into OCAD:
