OCAD Internet Map: Difference between revisions
No edit summary |
|||
| (36 intermediate revisions by 7 users not shown) | |||
| Line 1: | Line 1: | ||
==Export OIM== | ==Export OIM [[File:Space.PNG]][[File:Pro40px.PNG|This function is available in OCAD 11 Professional.|link=https://www.ocad.com/en/products/ocad-for-cartography]]== | ||
[[File:Export.PNG]] | [[File:Export.PNG]] | ||
| Line 7: | Line 7: | ||
With OIM you can publish big OCAD maps on internet. You can insert the OCAD Internet Map to a HTML file. | With OIM you can publish big OCAD maps on internet. You can insert the OCAD Internet Map to a HTML file. | ||
* '''Resolution:''' Enter here the resolution | * '''Resolution:''' Enter here the resolution for the map tiles (GIF). | ||
* '''Part of map:''' Activate this check box to export a part of the map. The map section will be shown with a rectangle on the drawing window. You can alter the rectangle with the mouse. | * '''Part of map:''' Activate this check box to export a part of the map. The map section will be shown with a rectangle on the drawing window. You can alter the rectangle with the mouse. | ||
: Click the button | : Click the Setup button [[File:Setup.JPG|setup]] to define the part of map to be exported by coordinates. The dialog box Setup Part of Map (Export) appears. | ||
: Click the | : Click the Entire map button [[File:EntireMap.JPG|entire map]] to export the entire map. | ||
: Click the | : Click the To current view button [[File:ToCurrentView.JPG|to current view]] to export the currently on the screen displayed map. | ||
: If this check box is not active the entire map will be exported. | : If this check box is not active the entire map will be exported. | ||
[[File:Hint.jpg]] It is also possible to choose a defined format like A4 landscape. | [[File:Hint.jpg]] It is also possible to choose a defined format like A4 landscape. | ||
-> Click '''Export'''. The | -> Click '''Export'''. The '''Export OCAD Internet Map''' dialog box appears. | ||
===OCAD Internet Map (OIM) Export Wizard=== | |||
=== | ====General Project Settings==== | ||
* Map title - heading of the map | |||
* Map subtitle - may be a copyright statement or similar | |||
'''Base map layout:''' | |||
: Base layer name - name of the map (e.g. Citymap of Baar) | |||
: Edit layer enable - enables the users the ability to draw on the map | |||
: Global searchbox - search for POI's (works only with PHP support) | |||
: Search with selection - search only in one POI category, for example streets | |||
* Create tiles - need to be selected if the map tiles should be created, otherwise only the meta files are created | |||
: Edit layer enable | |||
: | |||
: | |||
* | |||
-> Click '''Next''' | -> Click '''Next''' | ||
<gallery widths=400px heights=400px> | |||
File:OIMExportAssistant1.PNG|General project settings | |||
File:OIMExportAssistantZoomLevels.PNG|Zoomlevel settings | |||
</gallery> | |||
==== | ====Zoom Level Settings==== | ||
Select '''Zoom from''' and '''Zoom to''' levels which are created. Be aware that the overview map need a zoom level 0. | |||
Generated levels are highlighted green, not created levels are grayed out. If the file is not found it is highlighted in red. | |||
''' | * '''Relink''' - change the folder of all maps | ||
* | * '''Change''' - change the map for the selected zoom level | ||
* | * '''Reset all to current file''' - currently opened file is taken for all zoom levels | ||
-> Click '''Next''' | -> Click '''Next''' | ||
==== | ====Layout and Functionality Settings==== | ||
'''Control Options:''' | |||
* Show layer selector - enables the user select different POI groups | |||
* Show overview map - enables the overview map feature | |||
: Maximize overview map - shows the map maximized by default | |||
* Show coordinates - show coordinates in the lower right corner | |||
* Show permalink - enables the user the ability to link to a specific zoom, map view and layers | |||
'''Color and Size Settings:''' | |||
* | * Header font color - color of the map title | ||
* | * Header background color - background of the map title | ||
* | * Sub header font color - color of the map subtitle | ||
* | * Subhead background color - background of the map subtitle | ||
* Border color - border color of the map | |||
* Site background color - general site background | |||
- | * Font size - font size of the map title | ||
* Sub header font size - font size of the map subtitle (e.g. copyright) | |||
* Border width - thickness of the border | |||
<gallery widths=400px heights=400px> | |||
File:MapLayout.PNG|Layout and settings of the OCAD Internet Map | |||
</gallery> | |||
-> Click '''Next''' | -> Click '''Next''' | ||
====Points of Interest (POI)==== | |||
{| style="float:right; background:transparent; padding:0px; margin:0px;" | |||
|- valign="top" | |||
|[[File:OIMExportAssistantPOIOverview.png|thumb|left|400px|Overview about all POI's exported]] | |||
|} | |||
Choose '''Add''' to add a POI layer. The '''POI Selector''' dialog box appears: | |||
* | * Title - name of the layer | ||
* | * Dataset - dataset to choose from | ||
* | * Condition - with an SQL expression the result set can be limited.<BR> | ||
* | e.g.:<BR> | ||
* | location like 'myplace'<BR> | ||
or<BR> | |||
symbolnumber = 521.000<BR> | |||
* Location field - name, it's the main name of the POIs, which is shown in the search | |||
* Hover title on mouse over - a tooltip will be provided if the mouse moves over the poi | |||
* Highlight POI through search result - an arrow will blink three times when the POI is selected from the search box | |||
* Visible from zoom level - shows the entire overlay starting from the given zoom level. e.g.: show from zoom level 3 on | |||
* Point of interest type: | |||
:: -Point (vector) - POIs are drawn as yellow dot on the map | |||
:: -Icon (information bubbles) - POIs are represented with the provided icon file | |||
-> Click ''' | -> Click '''Next''' | ||
===== POI Icon Settings (if choosen) ===== | |||
Icon settings (only if '''icon''' is chosen in the previous step): | |||
* Icon - click the '''select''' button and choose a file (red background if file not found) | |||
* Icon offset - offset from the anchor point | |||
* Icon size - size of the icon (only in html, image will not be resized) | |||
-> Click '''Next''' | |||
===== POI Vector Settings (if chosen) ===== | |||
* | Vector settings (only if '''vector''' is chosen in the previous step): | ||
* | * Point fill color - represents the main color of the vector point. Opacity settings apply to this color. | ||
* | * Point stroke color | ||
* Point radius - size of the vector point | |||
* Point fill opacity - applies to the main color. | |||
* Point stroke opacity - applies on the stroke color | |||
If you set both values to 0 - they are transparent to the web map user. | |||
-> Click '''Next''' | |||
===== POI General settings ===== | |||
* Short description - database field containing short description (important for search) | |||
* Description - database field containing description for the info bubble or the right info box | |||
* URL field - database field containing the URL | |||
* Link name - database field containing a link name - if the URL should be shown select the same as in URL | |||
* Link target - link target for the browser | |||
URL, Link name and target are not mandatory fields. | |||
-> Click '''Finish''' | |||
<gallery widths=200px heights=200px> | |||
: | File:OIMExportAssistantPOISelector.PNG |POI Selector | ||
: | File:OIMExportAssistantPOIIconSettings.png | POI Icon settings (if chosen) | ||
File:OIMExportAssistantPOIVectorSettings.png | POI Vector settings (if chosen) | |||
File:OIMExportAssistantPOIDatafields.png | POI General settings | |||
</gallery> | |||
''' | Choose a directory and '''Save''' the file. To see the exported internet map open the *.html file in the browser. | ||
The search functionality only works on a server with PHP support otherwise the error message '''AJAX error: 0''' occurs.<br> | |||
[[File:ExportOimAjaxError0.png]] | |||
On the site [[HTML_Entities| HTML Entities]] the supported and convertable HTML characters can be seen. | |||
More advanced functions can be scripted. Examples can be found under [[OCAD_Internet_Map_scripting | OIM scripting]] | |||
Example of an OCAD Internet Map export: [http://ocad.com/demo/OIM_StMoritz/StMoritz.html Internet Map St. Moritz] | |||
== How To Add Second Base Map Layer to the OCAD Internet Map== | |||
* Make 2 OCAD Internet Map exports with different base map (ex. one with a topographic map and the other with an aerial image). Save them to different folders. | |||
* Navigate to the folder of the 2nd export and rename the sub folder ''map_tiles'' to ''map_tiles2''. | |||
* Copy ''map_tiles2'' to the folder of the 1st OIM export. There should be now two sub folders ''map_tiles'' and ''map_tiles2''. | |||
<gallery widths=246px heights=175px> | |||
File:Oim2ndLayerFolders.png | |||
</gallery> | |||
* Navigate from the 1st OIM export folder to the sub folder ''scripts'' and open the file ''BasisFunctions.js'' in a text editor. Duplicate the function ''overlay_getTileURL'' and rename the 2nd to ''overlay_getTileURL2''. Within this ''''overlay_getTileURL2'' function rename ''map_tiles'' to ''map_tiles2''. | |||
<gallery widths=705px heights=397px> | |||
File:Oim2ndLayerBasisFunctions.png | |||
</gallery> | |||
* Open the OIM main html file from the OIM export folder in an editor and duplicate the ''basemap'' section and add them as ''basemap1'' and ''basemap2''. Change the layer name for ''basemap2'' to ''Orthophoto'' (or something else...) and call the ''overlay_getTileURL2''. Duplicate also ''map.addLayer(basemap)'' add it as ''map.addLayer(basemap1)'' and ''map.addLayer(basemap2)''. | |||
<gallery widths=756px heights=267px> | |||
File:Oim2ndLayerInitBasemap.png | |||
</gallery> | |||
Previous Chapter: [[Server Client]] | Previous Chapter: [[Server Client]] | ||
Next Chapter : [[ | Next Chapter : [[Tutorials]] | ||
Back to [[Main Page]] | Back to [[Main Page]] | ||
Latest revision as of 09:00, 17 October 2014
Export OIM 


Choose Export OCAD Internet Map from File menu to export the map as OIM (OCAD Internet Map).
With OIM you can publish big OCAD maps on internet. You can insert the OCAD Internet Map to a HTML file.
- Resolution: Enter here the resolution for the map tiles (GIF).
- Part of map: Activate this check box to export a part of the map. The map section will be shown with a rectangle on the drawing window. You can alter the rectangle with the mouse.
- Click the Setup button
 to define the part of map to be exported by coordinates. The dialog box Setup Part of Map (Export) appears.
 - Click the Entire map button
 to export the entire map.
 - Click the To current view button
 to export the currently on the screen displayed map.
 - If this check box is not active the entire map will be exported.
![]() It is also possible to choose a defined format like A4 landscape.
It is also possible to choose a defined format like A4 landscape.
-> Click Export. The Export OCAD Internet Map dialog box appears.
OCAD Internet Map (OIM) Export Wizard
General Project Settings
- Map title - heading of the map
- Map subtitle - may be a copyright statement or similar
Base map layout:
- Base layer name - name of the map (e.g. Citymap of Baar)
- Edit layer enable - enables the users the ability to draw on the map
- Global searchbox - search for POI's (works only with PHP support)
- Search with selection - search only in one POI category, for example streets
- Create tiles - need to be selected if the map tiles should be created, otherwise only the meta files are created
-> Click Next
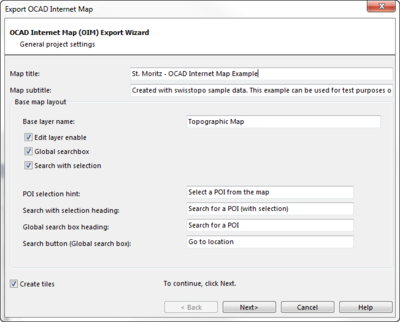
General project settings

Zoomlevel settings


Zoom Level Settings
Select Zoom from and Zoom to levels which are created. Be aware that the overview map need a zoom level 0.
Generated levels are highlighted green, not created levels are grayed out. If the file is not found it is highlighted in red.
- Relink - change the folder of all maps
- Change - change the map for the selected zoom level
- Reset all to current file - currently opened file is taken for all zoom levels
-> Click Next
Layout and Functionality Settings
Control Options:
- Show layer selector - enables the user select different POI groups
- Show overview map - enables the overview map feature
- Maximize overview map - shows the map maximized by default
- Show coordinates - show coordinates in the lower right corner
- Show permalink - enables the user the ability to link to a specific zoom, map view and layers
Color and Size Settings:
- Header font color - color of the map title
- Header background color - background of the map title
- Sub header font color - color of the map subtitle
- Subhead background color - background of the map subtitle
- Border color - border color of the map
- Site background color - general site background
- Font size - font size of the map title
- Sub header font size - font size of the map subtitle (e.g. copyright)
- Border width - thickness of the border

Layout and settings of the OCAD Internet Map

-> Click Next
Points of Interest (POI)

Choose Add to add a POI layer. The POI Selector dialog box appears:
- Title - name of the layer
- Dataset - dataset to choose from
- Condition - with an SQL expression the result set can be limited.
e.g.:
location like 'myplace'
or
symbolnumber = 521.000
- Location field - name, it's the main name of the POIs, which is shown in the search
- Hover title on mouse over - a tooltip will be provided if the mouse moves over the poi
- Highlight POI through search result - an arrow will blink three times when the POI is selected from the search box
- Visible from zoom level - shows the entire overlay starting from the given zoom level. e.g.: show from zoom level 3 on
- Point of interest type:
- -Point (vector) - POIs are drawn as yellow dot on the map
- -Icon (information bubbles) - POIs are represented with the provided icon file
-> Click Next
POI Icon Settings (if choosen)
Icon settings (only if icon is chosen in the previous step):
- Icon - click the select button and choose a file (red background if file not found)
- Icon offset - offset from the anchor point
- Icon size - size of the icon (only in html, image will not be resized)
-> Click Next
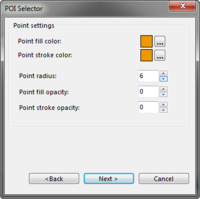
POI Vector Settings (if chosen)
Vector settings (only if vector is chosen in the previous step):
- Point fill color - represents the main color of the vector point. Opacity settings apply to this color.
- Point stroke color
- Point radius - size of the vector point
- Point fill opacity - applies to the main color.
- Point stroke opacity - applies on the stroke color
If you set both values to 0 - they are transparent to the web map user. -> Click Next
POI General settings
- Short description - database field containing short description (important for search)
- Description - database field containing description for the info bubble or the right info box
- URL field - database field containing the URL
- Link name - database field containing a link name - if the URL should be shown select the same as in URL
- Link target - link target for the browser
URL, Link name and target are not mandatory fields.
-> Click Finish

POI Selector

POI Icon settings (if chosen)
POI Vector settings (if chosen)

POI General settings


Choose a directory and Save the file. To see the exported internet map open the *.html file in the browser.
The search functionality only works on a server with PHP support otherwise the error message AJAX error: 0 occurs.

On the site HTML Entities the supported and convertable HTML characters can be seen.
More advanced functions can be scripted. Examples can be found under OIM scripting
Example of an OCAD Internet Map export: Internet Map St. Moritz
How To Add Second Base Map Layer to the OCAD Internet Map
- Make 2 OCAD Internet Map exports with different base map (ex. one with a topographic map and the other with an aerial image). Save them to different folders.
- Navigate to the folder of the 2nd export and rename the sub folder map_tiles to map_tiles2.
- Copy map_tiles2 to the folder of the 1st OIM export. There should be now two sub folders map_tiles and map_tiles2.

- Navigate from the 1st OIM export folder to the sub folder scripts and open the file BasisFunctions.js in a text editor. Duplicate the function overlay_getTileURL and rename the 2nd to overlay_getTileURL2. Within this ''overlay_getTileURL2 function rename map_tiles to map_tiles2.

- Open the OIM main html file from the OIM export folder in an editor and duplicate the basemap section and add them as basemap1 and basemap2. Change the layer name for basemap2 to Orthophoto (or something else...) and call the overlay_getTileURL2. Duplicate also map.addLayer(basemap) add it as map.addLayer(basemap1) and map.addLayer(basemap2).

Previous Chapter: Server Client
Next Chapter : Tutorials
Back to Main Page