Visualisation von Katastervermessungsdaten für Stadtkarten: Unterschied zwischen den Versionen
Admin (Diskussion | Beiträge) Keine Bearbeitungszusammenfassung |
Admin (Diskussion | Beiträge) Keine Bearbeitungszusammenfassung |
||
| Zeile 15: | Zeile 15: | ||
:-> '''OK''' | :-> '''OK''' | ||
[[File:Hint. | [[File:Hint.PNG]] Click [[File:ShowEntireMap.PNG]] '''Show Entire Map'''. | ||
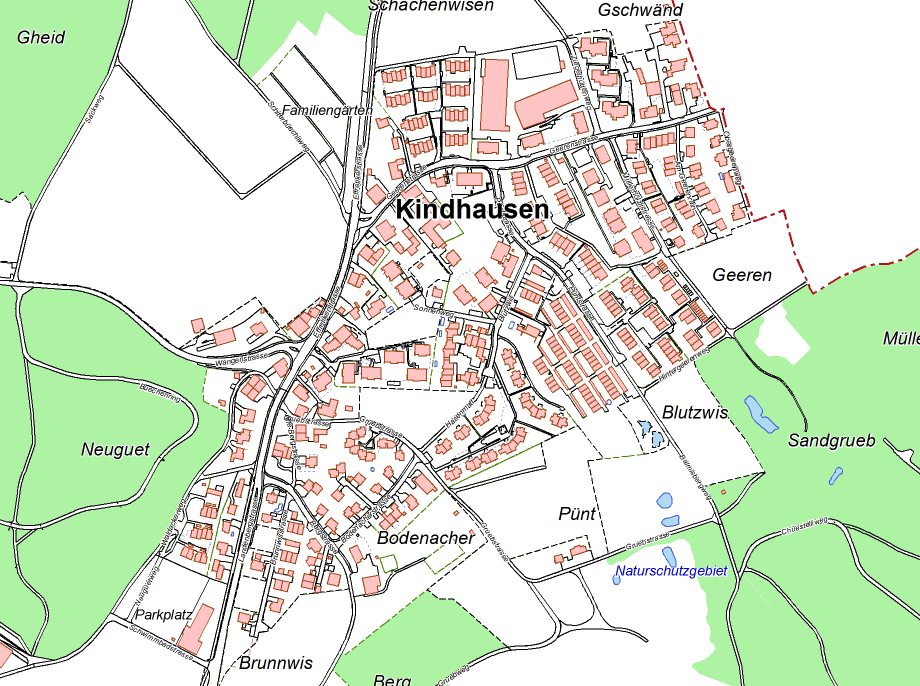
[[File:Kindhausen05.PNG]] | [[File:Kindhausen05.PNG]] | ||
Version vom 9. November 2011, 12:22 Uhr
Link: http://www.cadastre.ch/internet/cadastre/en/home/topics/avs/structure.html
Open OCAD file
Open the file Symbol Set Amtliche Vermessung.ocd.
Import Kindhausen_dxf.dxf
Datei:Kindhausen ImportDXFFile.PNG
Check Import INSERT as point object
- -> OK
Datei:Hint.PNG Click Datei:ShowEntireMap.PNG Show Entire Map.
Datei:Hint.JPG Select an object with the mouse, to see on which layer it is located. The layer information is based on "DXF-Geobau Layerdefinition" (Swiss standards SN 612'020).
Convert imported layer
choose Convert Imported Layer to Symbols from Map menu and Load Basisplan_DXF_Layerstruktur.crt.
Datei:Kindhausen ConvertImportedLayerToSymbols.PNG
- -> Execute
DEM Import
choose DEM Import from DEM menu and Add Kindshausen_asci.asc.
- -> Analayze and Save as an ocdDem file.
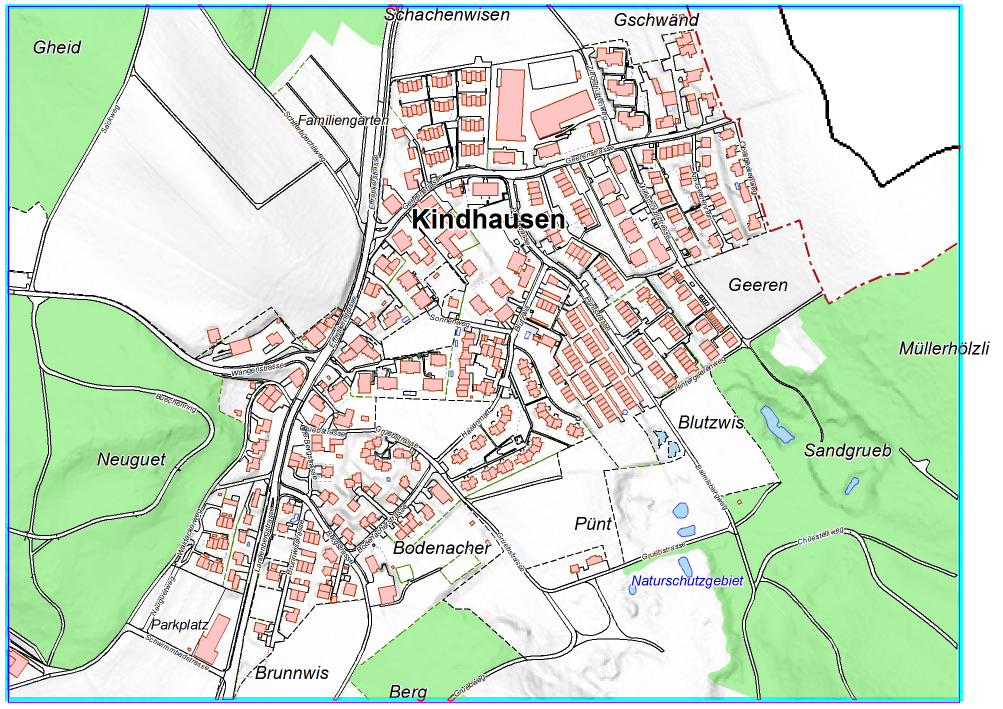
[Create Hill Shading]
Choose Create Hill Shading from DEM menu. Choose Hill shading (slope shading combined with oblique light shading) and check Load the exported map as backgroundmap.
Datei:Hint.JPG To see the results better, set Exaggeration to 8.
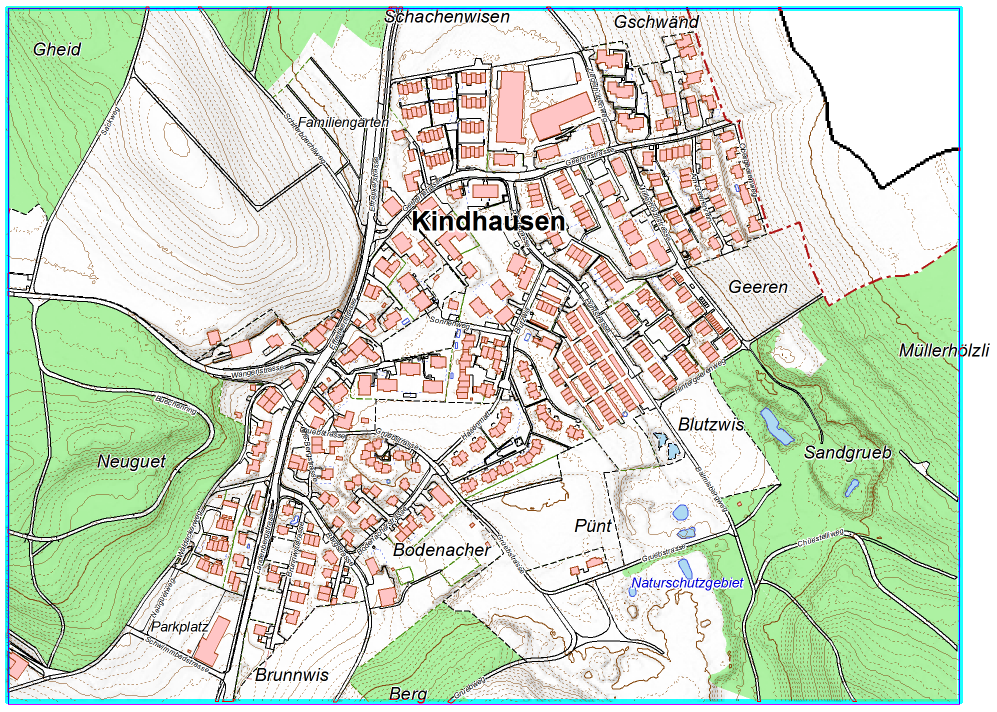
[Create Contour Lines]
Choose Create Contour Lines from DEM menu. Select desired Contour interval and appropriate line symbols.
- -> OK


