Visualization of GIS data for topographic maps
In this example data taken from Switzerland - [TLM (swisstopo)].
Open the file Symbolset_TLM.ocd.
Import all shape files from the directory swisstlm3dlv03ln02shp (File -> Import).
Select desired settings:
- Cordinate system: Swiss Grid CH1903
- Check: Existing offset and angle
- Database type: Microsoft Access 2003/2010 mdb
- Keyfield in database: Create new key field
- Imported layer: Do not import any layer information
- -> Click OK.
![]() Do not import the shape files Haltestelle Bahn and Gewaessernetzknoten. This unsymbolized objects can not be assigned.
Do not import the shape files Haltestelle Bahn and Gewaessernetzknoten. This unsymbolized objects can not be assigned.
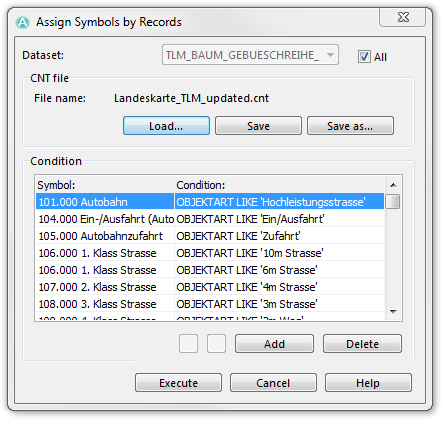
Choose Assign symbols by records to load the cnt file Landeskarte_TLM_updated.cnt and check the keyfield All.
- -> Execute
Assign Unsymbolized Objects:
Choose Add Text by Record from Database menu. Pick the dataset from the unsymbolized object (for example: TLM_GEBIETSNAME_CH) and the appropriate text field (for example: Name). Choose the symbol to be assigned (for example: 1309.000 Gebiet: gross) and check Assign text or line text symbol. Choose the Option Replace existing objects and click OK.
Assign these four objects correctly:
| Objektart | Symbol |
|---|---|
| Flurname | Gebiet klein |
| Ortschaft | Ort, -teil: 100-2'000 Einwohner |
| Huegel | Berg: klein |
Icons in the symbol box with a small red rectangle in the lower right half are shown in white:
- Graspiste
- Piste mit Hartbelag
- Übriges Gebiet
- Innenhof
- Bahnhofsareal
- Flughafenareal
- Flughafenbahnhofareal


