Visualization of GIS data for topographic maps
Jump to navigation
Jump to search
In this example data taken from Switzerland - [TLM (swisstopo)].
Open the file Symbolset_TLM.ocd.
- [[File:
Import all shape files from the directory swisstlm3dlv03ln02shp (File -> Import).
Select desired settings:
- Cordinate system: Swiss Grid CH1903
- Check: Existing offset and angle
- Database type: Microsoft Access 2003/2010 mdb
- Keyfield in database: Create new key field
- Imported layer: Do not import any layer information
- -> Click OK.
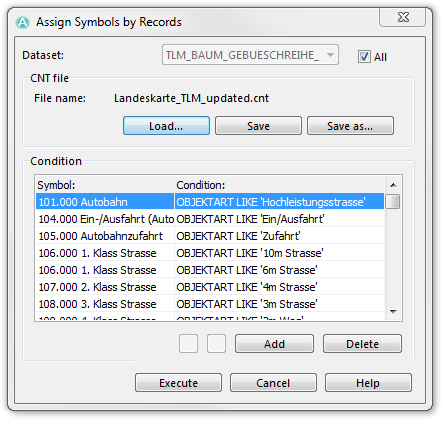
Choose Assign symbols by records to load the cnt file Landeskarte_TLM_updated.cnt and check the keyfield All.
- -> Execute
Assign Unsymbolized Objects:
| Objektart | Symbol |
|---|---|
| Flurname | Gebiet klein |
| Ortschaft | Ort, -teil: 100-2'000 Einwohner |
| Huegel | Berg: klein |

