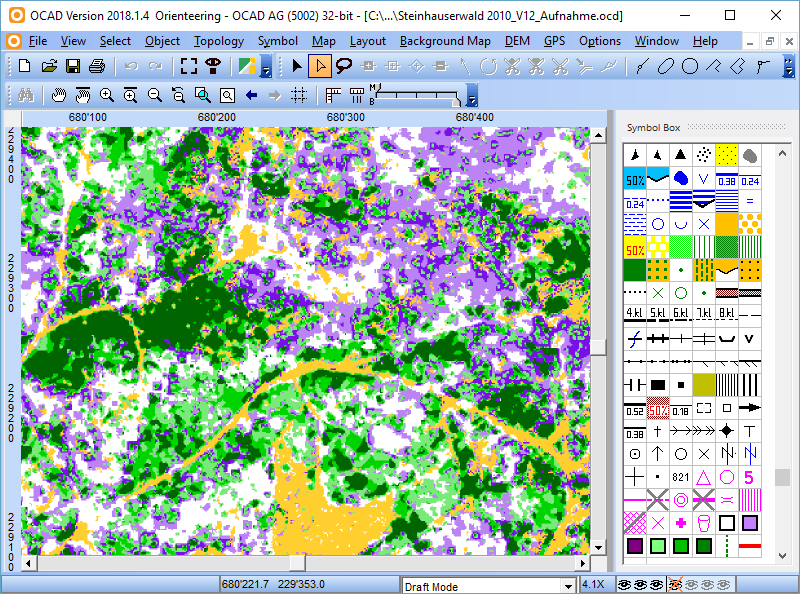
Using Airborne Laserscanning Data for Orienteering Base Map Generation
This tutorial shows a possible way to proceed LiDAR data in OCAD and how to use them when drawing orienteering maps. You find more detailed information about the DEM Wizward here.
Open New File
- Open OCAD.
- Go to File -> New -> Orienteering map: Choose a symbol set for orienteering maps and choose the scale (e.g Orienteering Map ISOM 2017 10000.ocd).
- Save the newly created file under File -> Save.
DEM Wizard
Open the DEM Wizard
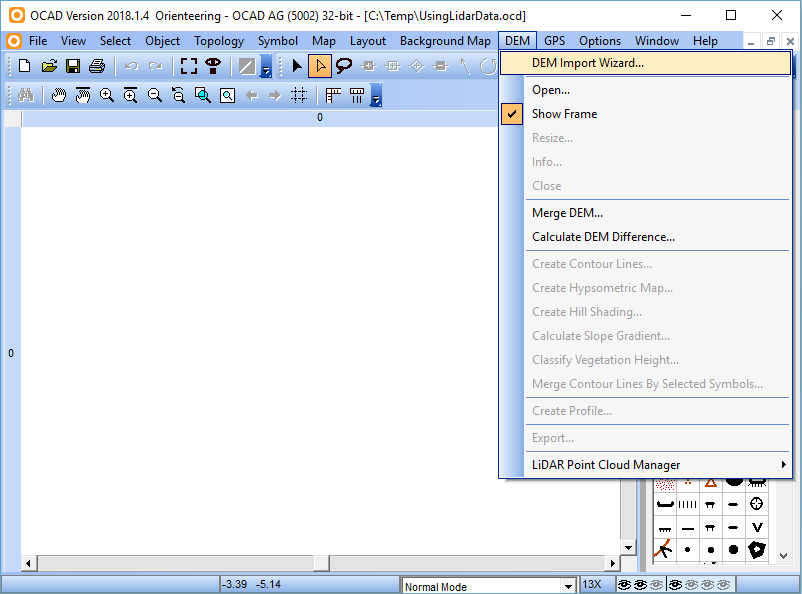
- Open the DEM Import Wizard in the DEM Menu.
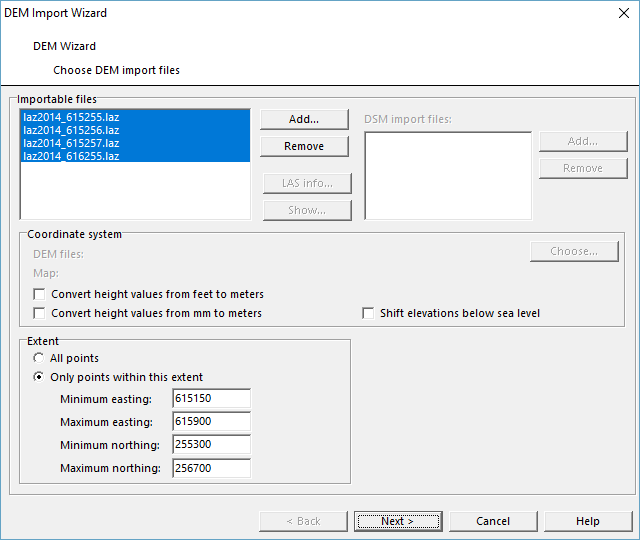
Choose DEM Import File
- Choose one or several importable files. In this tutorial we proceed a LAS-file.
DEM Settings
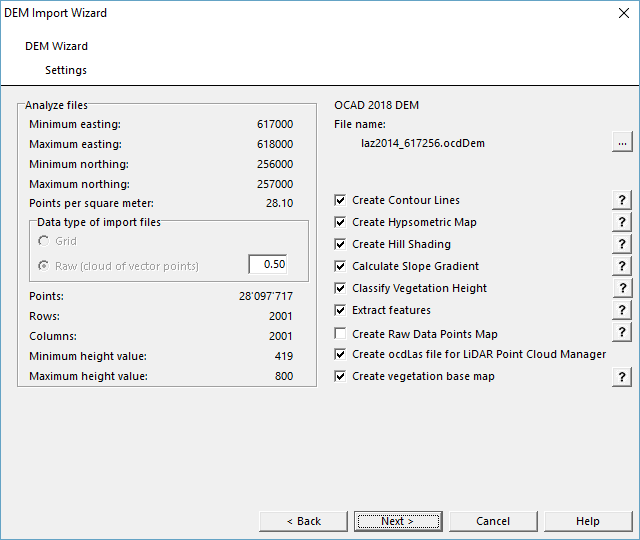
- In this tutorial, we have a look at all possible outputs. However, not all of them make sense for mapping. Enter the DEM Settings as follows.
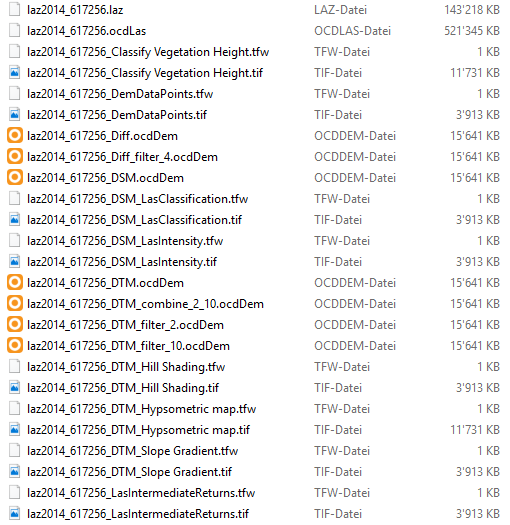
- Here you can choose your favourite folder (in the upper right corner under File name) where all files should be stored .
LAS Settings
- Select the LAS Settings as follows.
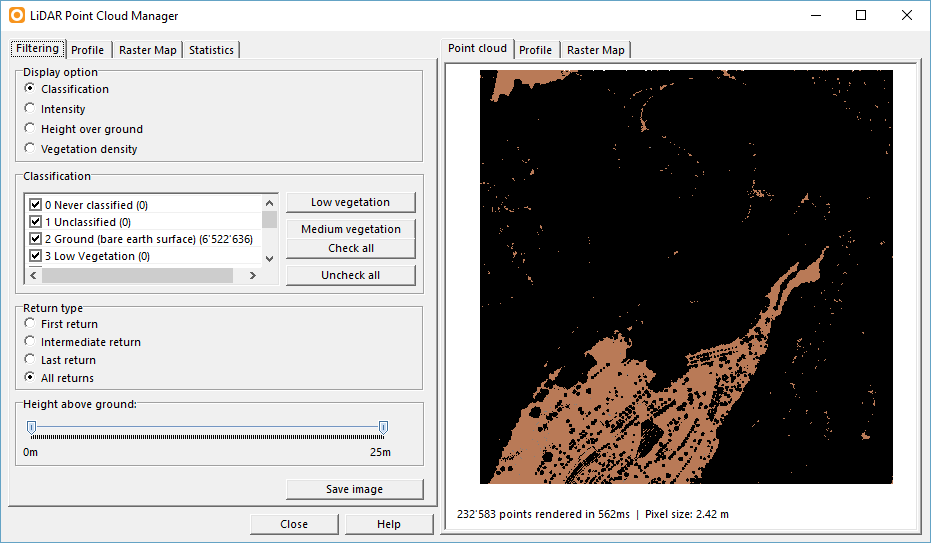
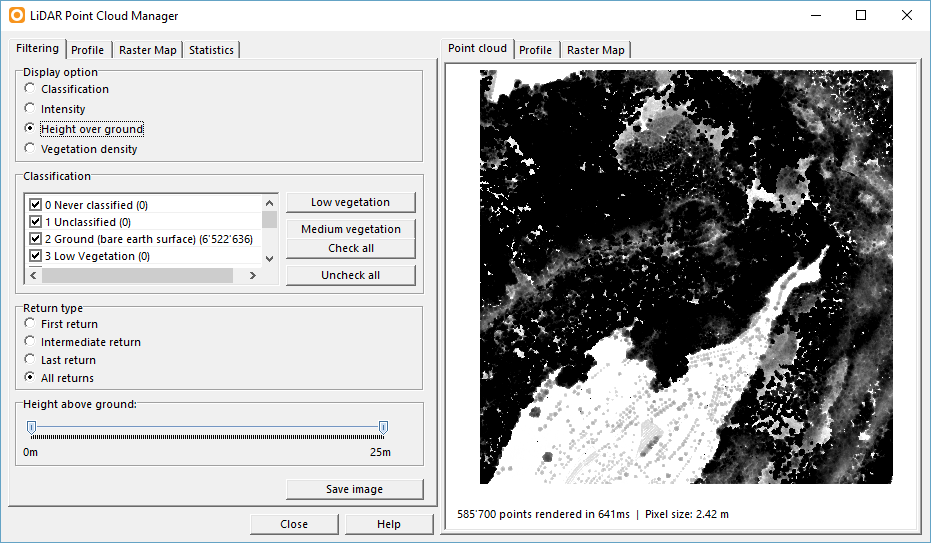
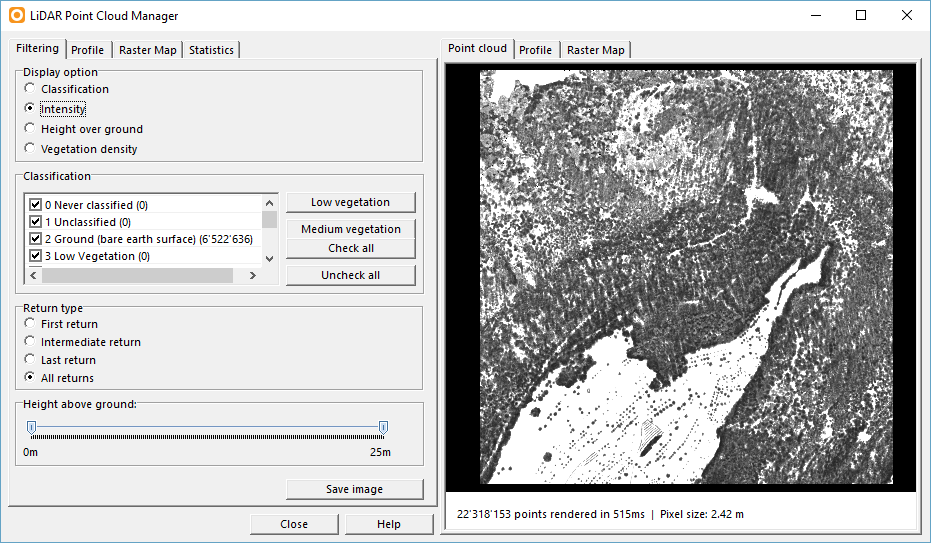
- We will need the .ocdlas-File in the LiDAR Point Cloud Manager section.
Create Contour Lines
- Select the settings for Create Contour Lines as follows.
- Activate both boxes Create custom contours (no smoothing) and Create smoothed contours using TPI.
- Choose as contour intervall 1m/5m/25m.
- Click on Load symbols from template to get 12 line symbols at the bottom of your symbol box. The boxes will be filled automatically.
- Choose Use different symbols for depression to distinguish depressions from hills.
Create Hypsometric Map
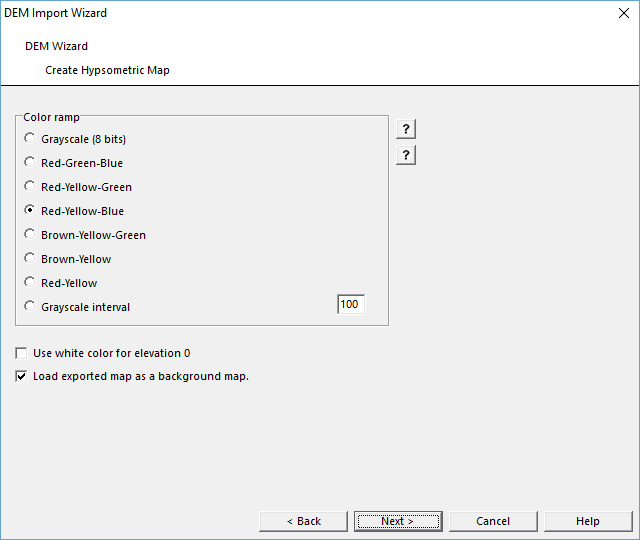
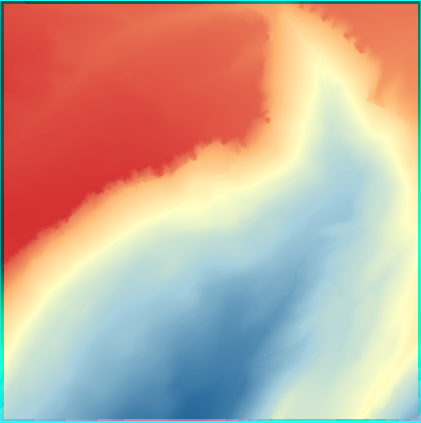
- Select the settings for Create Hypsometric Map as follows.
Create Hill Shading
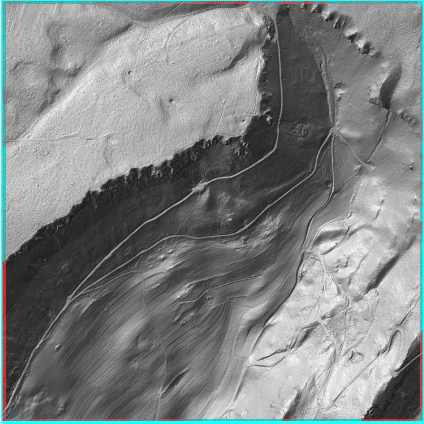
- Select the settings for Create Hill Shading as follows.
Create Slope Gradient
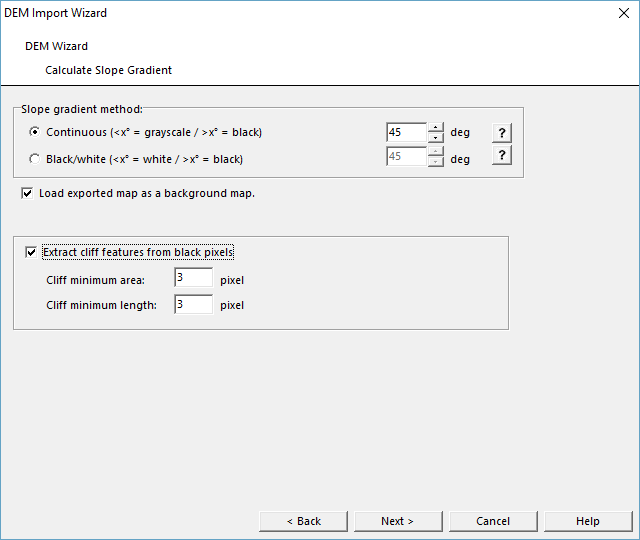
- Select the settings for Calculate Slope Gradient as follows.
- Check Extract cliff features from black pixels.
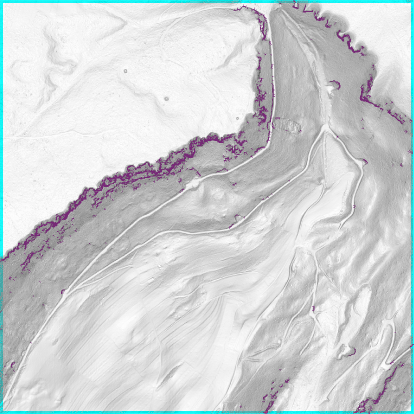
Cliff features as vector symbol (Slope Gradient Map is dimmed).
Classify Vegetation Height
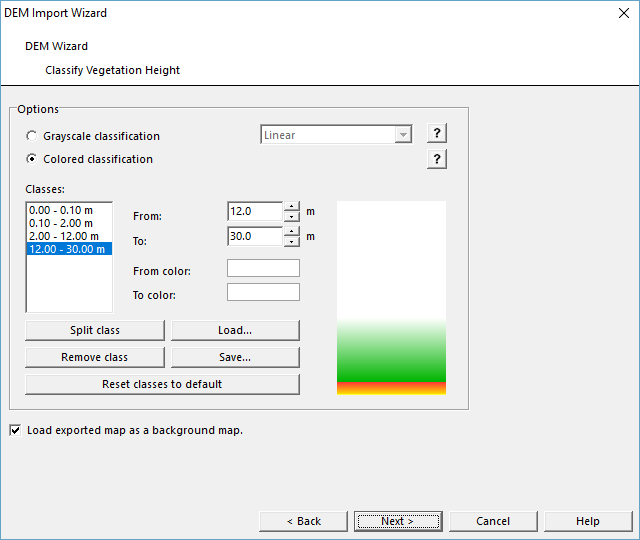
- Select the settings for Classify Vegetation Height as follows.
Extract Features
Summary
This dialog is only visible in DEM Import Wizard. It shows the progress of the different functions.
During the calculation, a message concerning georeferncing the map will pop up (unless the map is already georefernced). Do not change anything and click on Ok. After finishing the process the dialog closes automatically.

How to use the output?
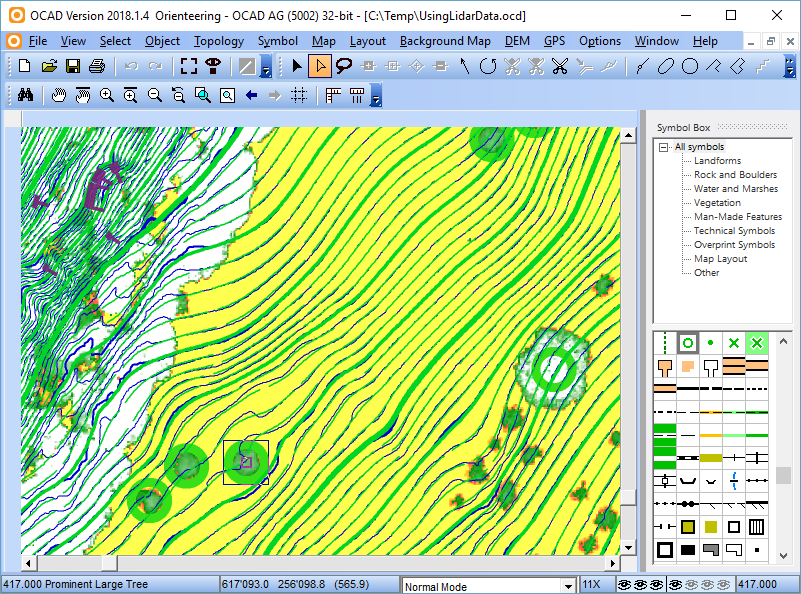
- After finishing the DEM Wizard the dialog closes automatically and the results are shown.
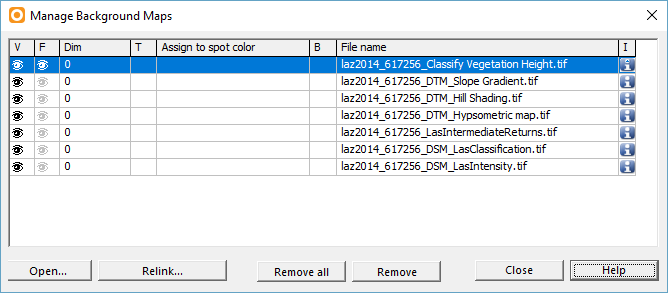
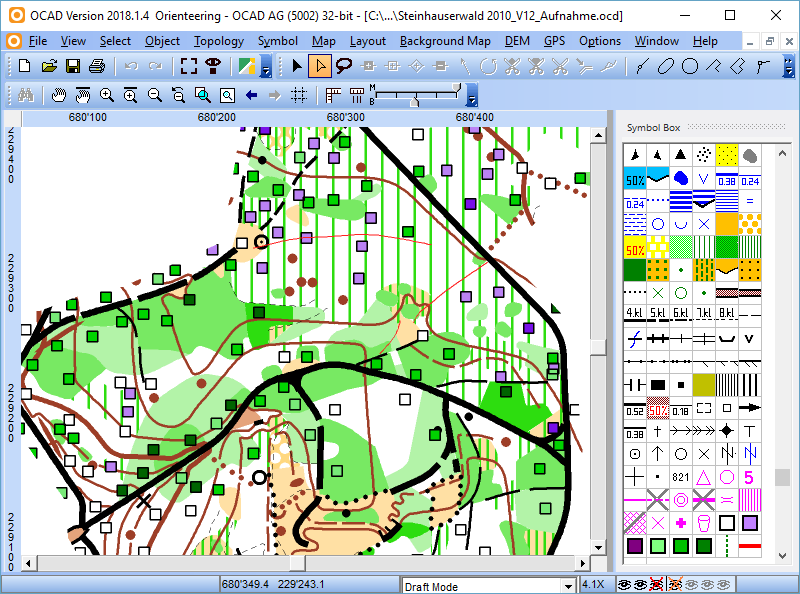
- All raster maps are loaded as background maps.
- Contour lines, cliff features and extracted features are assigned to the corresponing symbols in the Symbol box.
- All files are stored in the folder you specify in the DEM Settings.
