LiDAR Point Cloud Manager: Difference between revisions
(→Load) |
|||
| (16 intermediate revisions by 3 users not shown) | |||
| Line 1: | Line 1: | ||
The LiDAR Point Cloud Manager analyzes the vegetation within the forest and creates a vegetation raster map. The | The LiDAR Point Cloud Manager analyzes the vegetation within the forest and creates a vegetation raster map. The analys is based on a [[DEM_Import_Wizard#Create_ocdLas|ocdLas]] file created when importing las files in the '''[[DEM_Import_Wizard|DEM Import Wizard]]'''. | ||
==Load== | ==Load== | ||
This function loads an OCAD LAS file (*.ocdLas) and opens the '''[[LiDAR_Point_Cloud_Manager#Manage|LiDAR Point Cloud Manager]]'''. | This function loads an OCAD LAS file (*.ocdLas) and opens the '''[[LiDAR_Point_Cloud_Manager#Manage|LiDAR Point Cloud Manager]]'''. | ||
Alternatively, just drag and drop an ocdLas file into the drawing area. | |||
The OCAD LAS file is a LiDAR point cloud in an OCAD internal file format created in the [[DEM_Import_Wizard#Create_ocdLas|DEM Import Wizard]]. This file is optimized for fast access to the LiDAR points. | The OCAD LAS file is a LiDAR point cloud in an OCAD internal file format created in the [[DEM_Import_Wizard#Create_ocdLas|DEM Import Wizard]]. This file is optimized for fast access to the LiDAR points. | ||
| Line 25: | Line 26: | ||
This function reopens the '''LiDAR Point Cloud Manager''' with the already [[LiDAR Point Cloud Manager#Load|loaded ocdLas file]]. | This function reopens the '''LiDAR Point Cloud Manager''' with the already [[LiDAR Point Cloud Manager#Load|loaded ocdLas file]]. | ||
== | ==Filtering== | ||
This | This function shows the LiDAR point cloud as image according to the settings in filtering options. | ||
[[File:LidarPointCloudManager PointCloud.png]] | [[File:LidarPointCloudManager PointCloud.png]] | ||
It is the same extent as on the drawing area. The pixel size depends on the zoom level in the drawing area. When moving the cursor over the point cloud image the coordinate of the mouse cursor is shown in the status bar. | It is the same extent as on the drawing area in the OCAD File. The pixel size depends on the zoom level in the drawing area. When moving the cursor over the point cloud image the coordinate of the mouse cursor is shown in the status bar. | ||
In the ''Filtering'' tab there are four different display options: Classification, Intensity, Height over ground and Vegetation density. | In the ''Filtering'' tab there are four different display options: Classification, Intensity, Height over ground and Vegetation density. | ||
==== Display Option Classification ==== | ==== Display Option Classification ==== | ||
This option shows the classification of the LiDAR points. If more than one point is inside one cell then the point with the higher priority is shown. For example, the class ''Building'' has higher priority than ''Vegetation'' and ''Ground'' has the lowest priority. | This option shows the classification of the LiDAR points. If more than one point is inside one cell then the point with the higher priority is shown. For example, the class ''Building'' has higher priority than ''Vegetation'' and ''Ground'' has the lowest priority. | ||
[[File:LidarPointCloudManager_Classification.png]] | [[File:LidarPointCloudManager_Classification.png]] | ||
''Ground = Brown, Low Vegetation = Dark Green, Medium Vegetation = Light Green, High Vegetation = Green, Buliding = Black, Low Point = Grey'' | |||
====Display Option Intensity ==== | ====Display Option Intensity ==== | ||
| Line 44: | Line 48: | ||
==== Display Option Height Over Ground==== | ==== Display Option Height Over Ground==== | ||
This option shows the maximum height above ground for each cell. In this image high trees and vegetation boundaries can be detected. | This option shows the maximum height above ground for each cell. In this image, high trees and vegetation boundaries can be detected. The structure of the forest can be seen clearly. | ||
[[File:LidarPointCloudManager_HeightOverGround.png]] | [[File:LidarPointCloudManager_HeightOverGround.png]] | ||
==== Display Option Vegetation Density==== | ==== Display Option Vegetation Density==== | ||
This option shows the number of LiDAR points for each cell. Cells with more points are shown in darker red. Open areas have often less return points and | This option shows the number of LiDAR points for each cell. Cells with more points are shown in darker red. Open areas have often less return points and appear therefore in lighter red. | ||
[[File:LidarPointCloudManager_VegetationDensity.png]] | [[File:LidarPointCloudManager_VegetationDensity.png]] | ||
Click the '''Save''' button to create a geo-referenced png file from the point cloud image and load it as new background map. The file is automatically saved in the same folder as the ocd file. | Click the '''Save image''' button to create a geo-referenced png file from the current point cloud image and load it as new background map. The file is automatically saved in the same folder as the ocd file. | ||
===Classification=== | ===Classification=== | ||
| Line 78: | Line 82: | ||
[[File:LidarPointCloudManager PointCloud Classification HeightAboveGround.png]] | [[File:LidarPointCloudManager PointCloud Classification HeightAboveGround.png]] | ||
== | ==Vegetation Base Map== | ||
This function creates an ''Orienteering base map'' with user-defined information about the near-ground vegetation. Near-ground means between ground and 3m above. | This function creates an ''Orienteering base map'' with user-defined information about the near-ground vegetation. Near-ground means between ground and 3m above. | ||
When using this function the first time default values are set. The default values are optimized for [https://map.geo.admin.ch/?lang=en&topic=ech&bgLayer=ch.swisstopo.pixelkarte-farbe&layers=ch.swisstopo.zeitreihen,ch.bfs.gebaeude_wohnungs_register,ch.bav.haltestellen-oev,ch.swisstopo.swisstlm3d-wanderwege&layers_visibility=false,false,false,false&layers_timestamp=18641231,,,&X=229174&Y=680276&zoom=10&crosshair=marker Steinhauserwald] in Switzerland and LiDAR data from Canton Zürich. The settings depend on the forest type and the LiDAR data. | When using this function the first time default values are set. The default values are optimized for [https://map.geo.admin.ch/?lang=en&topic=ech&bgLayer=ch.swisstopo.pixelkarte-farbe&layers=ch.swisstopo.zeitreihen,ch.bfs.gebaeude_wohnungs_register,ch.bav.haltestellen-oev,ch.swisstopo.swisstlm3d-wanderwege&layers_visibility=false,false,false,false&layers_timestamp=18641231,,,&X=229174&Y=680276&zoom=10&crosshair=marker Steinhauserwald] in Switzerland and LiDAR data from Canton Zürich. The settings depend on the forest type and the LiDAR data. | ||
| Line 93: | Line 88: | ||
[[File:LidarPointCloudManager RasterMap.png]] | [[File:LidarPointCloudManager RasterMap.png]] | ||
=== Cell size=== | |||
Choose the cell size. | |||
===Undergroth and Vegetation=== | |||
====Range From==== | |||
Choose the range in which points should be considered as Undergrowth and Vegetation. | |||
====Neighborhood kernel==== | |||
Choose the amount of neighbouring cells for the calculation. | |||
====Thresholds==== | |||
The calculation based on the NDVD (Normalized Difference Vegetation Density). | The calculation based on the NDVD (Normalized Difference Vegetation Density). | ||
The thresholds for the undergrowth and the vegetation shall be between -1.0 and +1.0. The thresholds can be calculated with samples in the '''[[LiDAR_Point_Cloud_Manager#Statistics|Statistics]]''' function. The meaning of the thresholds is visible in the image below. | The thresholds for the undergrowth and the vegetation shall be between -1.0 and +1.0. The thresholds can be calculated with samples in the '''[[LiDAR_Point_Cloud_Manager#Statistics|Statistics]]''' function. The meaning of the thresholds is visible in the image below. | ||
| Line 100: | Line 104: | ||
[[File:LidarPointCloudManager Thresholds.png]] | [[File:LidarPointCloudManager Thresholds.png]] | ||
===Overlap Points from=== | |||
Overlap points is a classification type of LAS file format. These unclassified overlap points come from different scans (flight lines). | |||
Choose the lower threshold in which points should be considered as Undergrowth and Vegetation. If this as value is too low, ground points are used as undergrowth and vegetation points. | |||
===Use filter=== | |||
Use filter to generalize the map. | |||
===Show area with no data in red color=== | |||
Area with no data are shown in red color if the value is set to ''True''. Otherwise the cells are white and not specifiable from the forest cells. The filter option generalizes the raster map. | Area with no data are shown in red color if the value is set to ''True''. Otherwise the cells are white and not specifiable from the forest cells. The filter option generalizes the raster map. | ||
Click the ''' | |||
Click the '''Create''' button to calculate and show the ''Orienteering base map''. The map is drawn with the following colors: | |||
[[File:LidarPointCloudManager OrienteeringBaseMapColors.png]] | [[File:LidarPointCloudManager OrienteeringBaseMapColors.png]] | ||
| Line 118: | Line 129: | ||
[[File:LidarPointCloudManager Statistics.png]] | [[File:LidarPointCloudManager Statistics.png]] | ||
OCAD uses Microsoft Excel for this function. If Excel is not installed the following error message appears. | |||
[[File:LidarPointCloudManagerStatisticsExcelErrorMessage.png]] | |||
The following steps are to do: | The following steps are to do: | ||
| Line 125: | Line 140: | ||
=== Import Symbol from Template File=== | === Import Symbol from Template File=== | ||
Press the '''Shift''' key and click '''File''' -> '''Import'''. The file chooser opens in the ''Template'' subfolder of the OCAD program folder. Choose the ''Template Vegetation Samples.ocd'' file and click '''Open'''. In the Import OCAD Map dialog choose the option to ''Import all symbols and colors'' and ''at the top of the color table''. | Press the '''Shift''' key and click '''File''' -> '''Import'''. The file chooser opens in the ''Template'' subfolder of the OCAD program folder. Choose the ''Template Vegetation Samples.ocd'' file and click '''Open'''. In the ''Import OCAD Map'' dialog choose the option to ''Import all symbols and colors'' and ''at the top of the color table''. | ||
[[File:LidarPointCloudManager PointCloud ImportOptions.png]] | [[File:LidarPointCloudManager PointCloud ImportOptions.png]] | ||
Click OK. The 6 imported | Click OK. The 6 imported symbols are in the symbol box. | ||
[[File:LidarPointCloudManager PointCloud SymbolBox.png]] | [[File:LidarPointCloudManager PointCloud SymbolBox.png]] | ||
| Line 136: | Line 151: | ||
[[File:LidarPointCloudManager PointCloud Symbols.png|50%]] | [[File:LidarPointCloudManager PointCloud Symbols.png|50%]] | ||
=== Draw Samples=== | === Draw Samples=== | ||
Use these 6 symbols and draw samples for the expected vegetation. We recommend to draw totally more than 100 samples for the desired area. | Use these 6 symbols and draw samples for the expected vegetation. We recommend to draw totally more than 100 samples for the desired area. | ||
| Line 147: | Line 163: | ||
[[File:LidarPointCloudManager ThresholdsExcel.png]] | [[File:LidarPointCloudManager ThresholdsExcel.png]] | ||
==Profile== | |||
The profile shows the vegetation structure. | |||
In the OCAD window, choose any line symbol and draw a straight line inside the loaded ocdLas file and select the line object afterwards. | |||
In the LiDAR Point Cloud Manager window, choose the profile width and click the '''Show''' button. OCAD draws the profile according to the filter settings in the '''Filtering''' tab. | |||
[[File:LidarPointCloudManager Profile.png|794px]] | |||
Latest revision as of 12:24, 1 April 2020
The LiDAR Point Cloud Manager analyzes the vegetation within the forest and creates a vegetation raster map. The analys is based on a ocdLas file created when importing las files in the DEM Import Wizard.
Load
This function loads an OCAD LAS file (*.ocdLas) and opens the LiDAR Point Cloud Manager. Alternatively, just drag and drop an ocdLas file into the drawing area.
The OCAD LAS file is a LiDAR point cloud in an OCAD internal file format created in the DEM Import Wizard. This file is optimized for fast access to the LiDAR points.
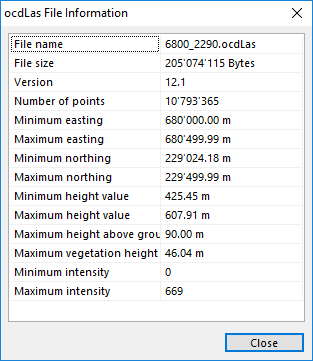
For more information about this file open the Information dialog.
Info
This function shows information about the ocdLas file.
When moving the mouse cursor over the file name then the full file path appears.
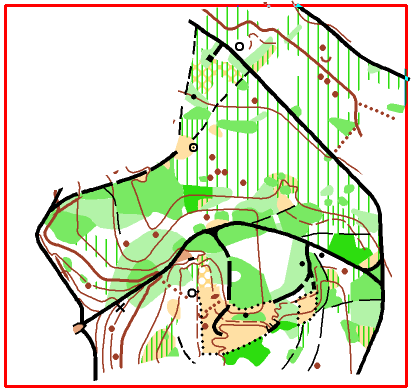
Show Frame
This function shows a red rectangle with the extent of the loaded ocdLas file.
Close
This function closes ocdLas file.
Manage
This function reopens the LiDAR Point Cloud Manager with the already loaded ocdLas file.
Filtering
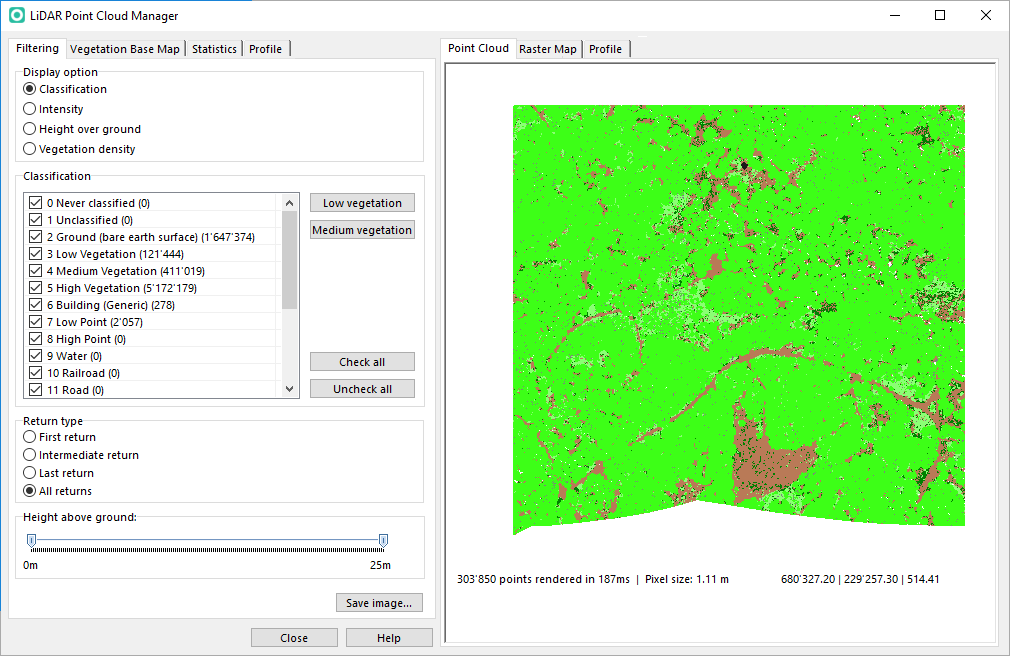
This function shows the LiDAR point cloud as image according to the settings in filtering options.
It is the same extent as on the drawing area in the OCAD File. The pixel size depends on the zoom level in the drawing area. When moving the cursor over the point cloud image the coordinate of the mouse cursor is shown in the status bar.
In the Filtering tab there are four different display options: Classification, Intensity, Height over ground and Vegetation density.
Display Option Classification
This option shows the classification of the LiDAR points. If more than one point is inside one cell then the point with the higher priority is shown. For example, the class Building has higher priority than Vegetation and Ground has the lowest priority.
Ground = Brown, Low Vegetation = Dark Green, Medium Vegetation = Light Green, High Vegetation = Green, Buliding = Black, Low Point = Grey
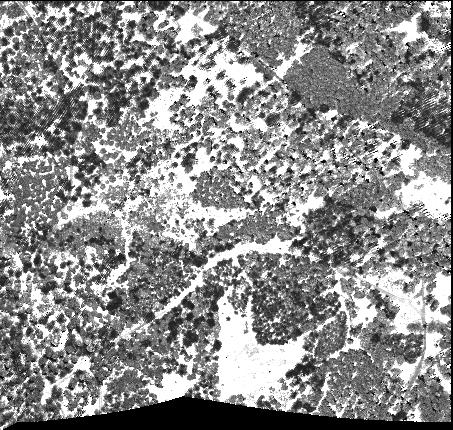
Display Option Intensity
This option shows the intensity of the LiDAR points. Lower intensity is drawn with darker color. In this image the different types of vegetation (deciduous and coniferous forest) and the vegetation boundaries are visible.
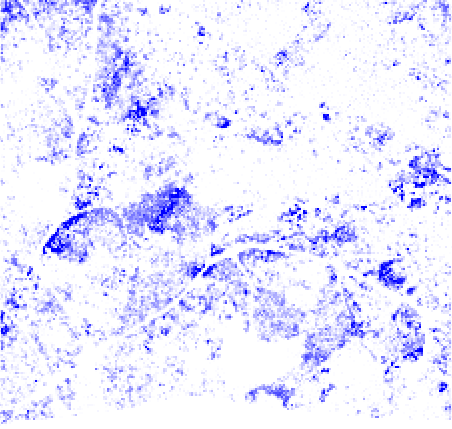
Display Option Height Over Ground
This option shows the maximum height above ground for each cell. In this image, high trees and vegetation boundaries can be detected. The structure of the forest can be seen clearly.
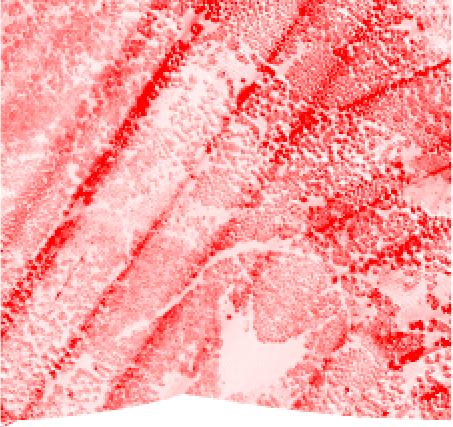
Display Option Vegetation Density
This option shows the number of LiDAR points for each cell. Cells with more points are shown in darker red. Open areas have often less return points and appear therefore in lighter red.
Click the Save image button to create a geo-referenced png file from the current point cloud image and load it as new background map. The file is automatically saved in the same folder as the ocd file.
Classification
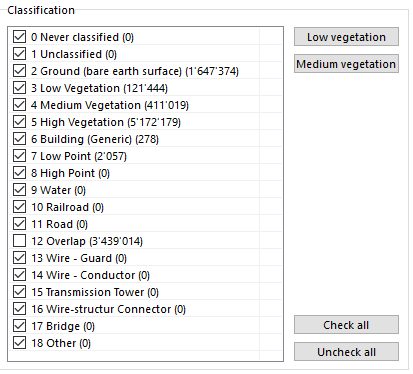
A list with the different classifications is shown. The value in parentheses is the number of points for this class. In some cases it is recommended to uncheck the Overlap points. The overlapping points come from the different flight lines.
Click the Low vegetation button to choose only the Low vegetation points and set the Height above ground filter to 0.1 - 1.0 m.
Click the Medium vegetation button to choose only the Medium vegetation points and set the Height above ground filter to 1.0 - 3.0 m.
Return Type
Choose which return types are shown. By default 'All returns' is chosen.
Height Above Ground
This function filters the points with the height above ground. To show only near-ground vegetation points move the left slider to 0.0 and the right to 3.0.
Vegetation Base Map
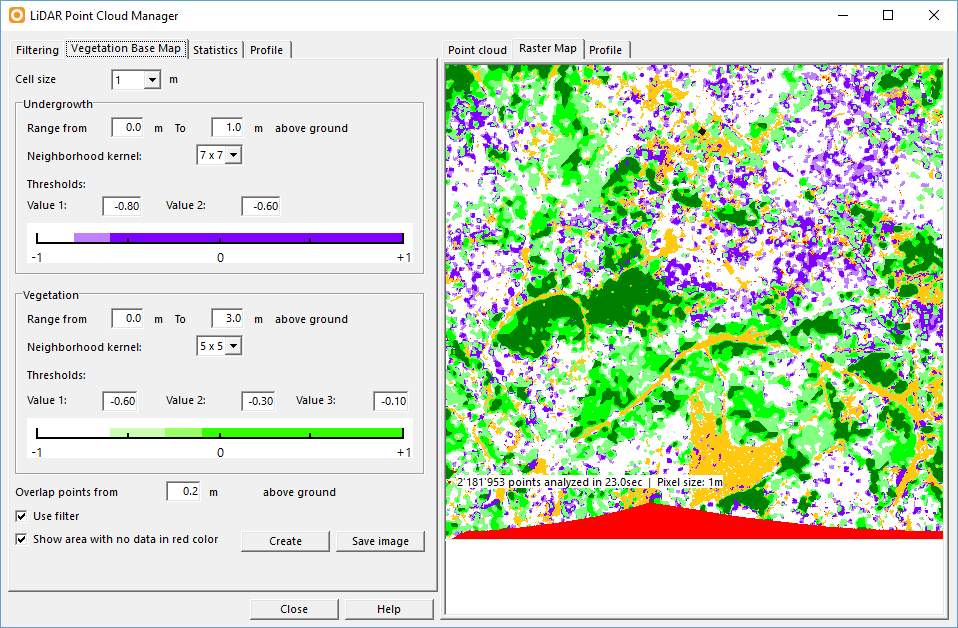
This function creates an Orienteering base map with user-defined information about the near-ground vegetation. Near-ground means between ground and 3m above. When using this function the first time default values are set. The default values are optimized for Steinhauserwald in Switzerland and LiDAR data from Canton Zürich. The settings depend on the forest type and the LiDAR data.
Cell size
Choose the cell size.
Undergroth and Vegetation
Range From
Choose the range in which points should be considered as Undergrowth and Vegetation.
Neighborhood kernel
Choose the amount of neighbouring cells for the calculation.
Thresholds
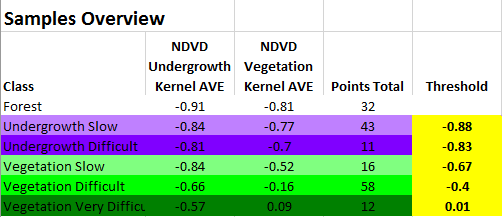
The calculation based on the NDVD (Normalized Difference Vegetation Density). The thresholds for the undergrowth and the vegetation shall be between -1.0 and +1.0. The thresholds can be calculated with samples in the Statistics function. The meaning of the thresholds is visible in the image below.
Overlap Points from
Overlap points is a classification type of LAS file format. These unclassified overlap points come from different scans (flight lines). Choose the lower threshold in which points should be considered as Undergrowth and Vegetation. If this as value is too low, ground points are used as undergrowth and vegetation points.
Use filter
Use filter to generalize the map.
Show area with no data in red color
Area with no data are shown in red color if the value is set to True. Otherwise the cells are white and not specifiable from the forest cells. The filter option generalizes the raster map.
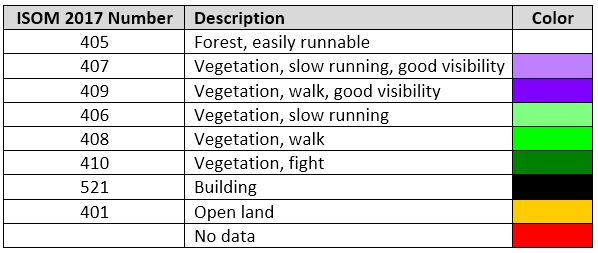
Click the Create button to calculate and show the Orienteering base map. The map is drawn with the following colors:
Click the Save image button to create a geo-referenced png file and load it as new background map. The file is automatically saved in the same folder as the ocd file.
The example below shows the Orienteering base map (left) and the map from field work (right).
Statistics
The statistics function can calculate the vegetation thresholds from samples.
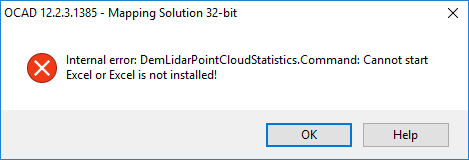
OCAD uses Microsoft Excel for this function. If Excel is not installed the following error message appears.
The following steps are to do:
- Import Symbol from Template File
- Draw Samples
- Create Statistics
Import Symbol from Template File
Press the Shift key and click File -> Import. The file chooser opens in the Template subfolder of the OCAD program folder. Choose the Template Vegetation Samples.ocd file and click Open. In the Import OCAD Map dialog choose the option to Import all symbols and colors and at the top of the color table.
Click OK. The 6 imported symbols are in the symbol box.
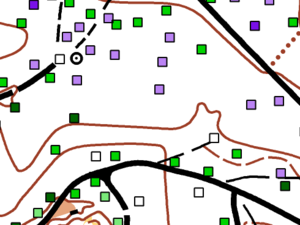
The symbol are for the vegetation samples and have the following meaning:
Draw Samples
Use these 6 symbols and draw samples for the expected vegetation. We recommend to draw totally more than 100 samples for the desired area.
Create Statistics
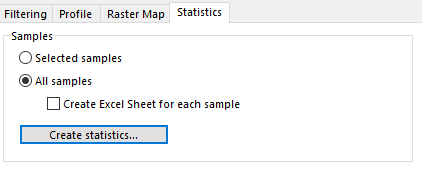
Click the Create statistics button to create an Excel file. The file opens automatically if Excel is installed.
The 5 thresholds (marked in yellow color in the images bellow) can be inserted in the Raster map settings.
Profile
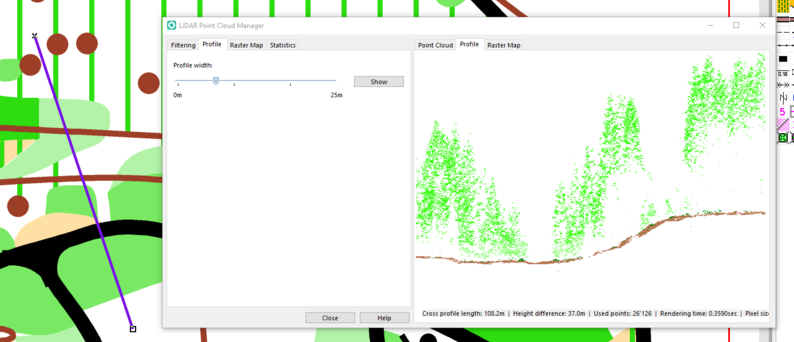
The profile shows the vegetation structure.
In the OCAD window, choose any line symbol and draw a straight line inside the loaded ocdLas file and select the line object afterwards.
In the LiDAR Point Cloud Manager window, choose the profile width and click the Show button. OCAD draws the profile according to the filter settings in the Filtering tab.
