Drawing Orienteering Maps in OCAD
The focus of this tutorial is how to draw an orienteering map with OCAD. It doesn’t matter if you start a new mapping project or update an old existing map.
About OCAD
Run OCAD
OCAD 2018 Orienteering and OCAD 2018 Mapping Solution are new available as 64-bit version and 32-bit version. The OCAD Setup installs both versions.
For normal use, the 32-bit version is sufficient. Please note, the 64-bit version isn't faster than the 32-bit version. The big advantage of 64-bit is that OCAD can allocate more than 3 GB RAM if available on the computer. That is important when loading huge raster background maps or DEM files.
Structure of the OCAD User Interface
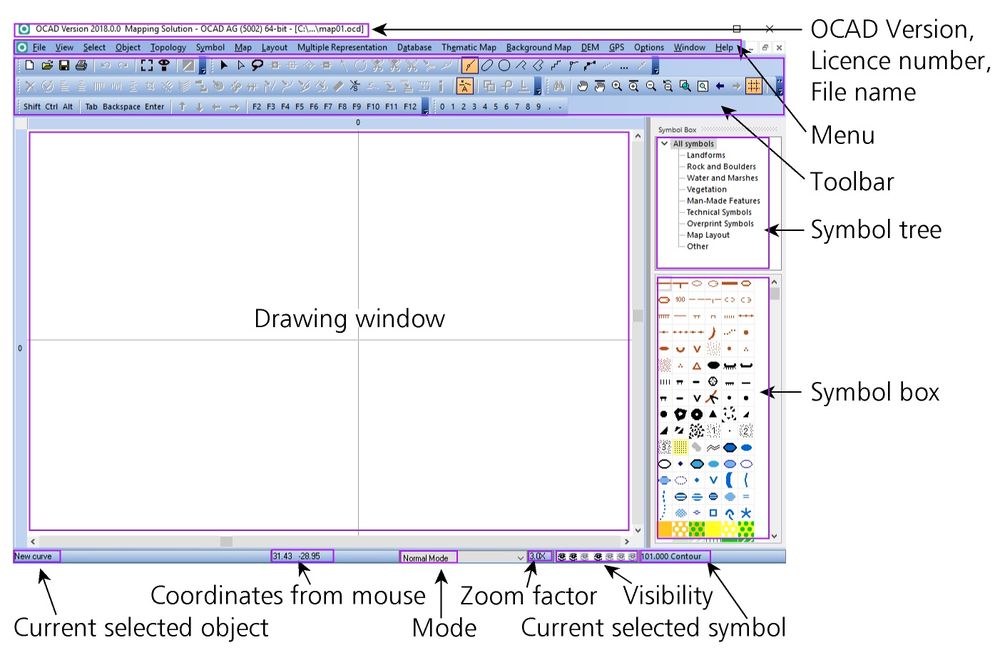
The image below shows you the OCAD User Interface.
OCAD Help
You will find the following submenus in the Help menu.
- Contents: Opens the OCAD Main Page.
- Menu: Help for menu commands.
- Toolbar: Help for toolbar buttons.
- Tutorial: Link to the OCAD Tutorials.
- What is New: See the newly added functions on this page.
- OCAD Home page: Opens OCAD homepage on the Internet.
- OCAD Service Update: Download the current Service Update.
- OCAD Tutorial Videos: Connect to Learning Videos on OCAD homepage.
- OCAD Youtube Channel: OCAD Youtube Channel
- Getting Started with OCAD 2018: Open the PDF file 'Getting Started with OCAD 2018'. For different languages see here
- OCAD Blog: Show the newest posts from the OCAD Blog.
- License Transfer Utility: Opens the License Transfer Utility to deactivate your license and transfer it to another user.
- License Manager: The License Manager tool shows an overview about the OCAD licenses which are assigned to your organization (company or association).
- About OCAD: General Information about OCAD like license information and current version of OCAD.
Service Update
Regular and free updates are included in the OCAD subscription model. The Service Update corrects known bugs and adds the latest cartography tools and enhancements to your OCAD.
Therefore we recommend using OCAD software always with the most recent Service Update to benefit from the quality improvements.
Please download the current Service Update from the Help -> OCAD Service Update function in the OCAD program.
The content of the Service Update is listed in the Release notes. Your current version of OCAD can be seen under About OCAD in the Help menu.
New Map
Start a New Map File
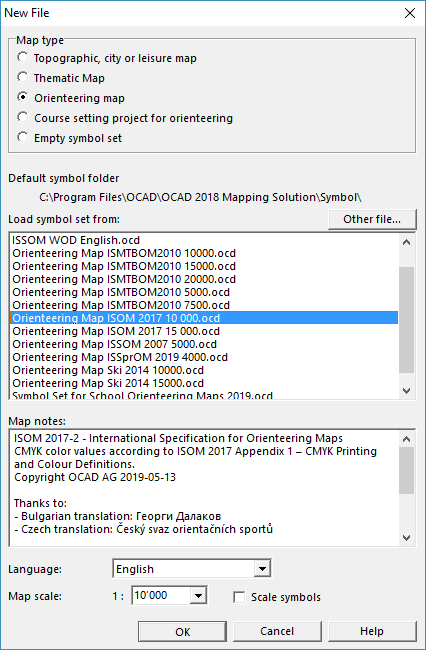
Before start mapping you should define which type of map you want to draw, which symbol set you want to use and which scale the map should have. For this tutorial we want to draw an normal forest orienteering map in scale 1:10'000.
To create a new map:
- Select New in the File menu. The New File dialog box appears.
- Choose a map type. OCAD provides predefined symbol sets to help you begin drawing your map immediately. Choose the symbol set Orienteering Map ISOM 2017 10000.ocd.
- Deside in which scale the map shall be drawn. Set the scale to 1:10'000.
- Choose the language of the symbol set. (only at ISOM 2017 available)
- By clicking the OK button, OCAD creates a new map and copies the chosen symbol set to it.
Click here to learn more about this step.
Set Scale and Coordinate System
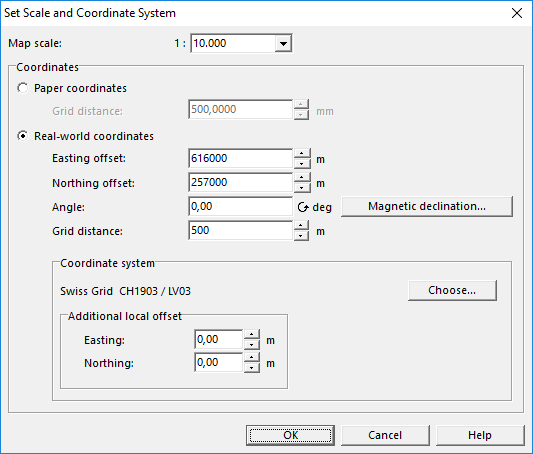
Select the Set Scale and Coordinate System item from the Map menu. The Set Scale and Coordinate System dialog box appears.
Enter the Map Scale
Enter a scale and click the OK button.
![]() Do not use this dialog to change the scale after entering the initial values. To increase or decrease the size of the map subsequently, use the Change Scale function in the Map menu. Setting the current scale does not enlarge or reduce the map. It only changes a number in the map file and georeferencing will be lost.
Do not use this dialog to change the scale after entering the initial values. To increase or decrease the size of the map subsequently, use the Change Scale function in the Map menu. Setting the current scale does not enlarge or reduce the map. It only changes a number in the map file and georeferencing will be lost.
Georeference the Map
Before loading a georeferenced Background Map, work with GPS data or import Spatial Base Data, we recommend that you first georeference the map. Georeferencing means, that you assign space-related reference information to objects in a spatial reference system. Shortly: A georeferenced map is assigned to a coordinate system. You should contact your data supplier, national surveying office or cartographic institute to find out which coordinate system will best suit your needs.
- Choose wheter you want define Paper coordinates (in mm) or Real world coordinates. We choose Real world coordinates for this tutorial.
- In the Easting offset and Northing offset fields, enter the coordinate values for the center of your map.
- The coordinate system can be rotated by entering a value in the Angle field. The "Angle" is the deviation from the magnetic North to the coordinate system. At the moment there are 0-degree deviation in Switzerland.
- In the Grid distance field, enter the desired distance for the Coordinate Grid lines.
![]() Enter the coordinate values for the center of your map in the horizontal and vertical offset fields. This is important since the drawing area of OCAD is limited to 4 x 4 m in the
Enter the coordinate values for the center of your map in the horizontal and vertical offset fields. This is important since the drawing area of OCAD is limited to 4 x 4 m in the Orienteering edition, in the
Starter edition as well as in the
Course Setting edition and 80 x 80 m in the
OCAD Mapping Solution. This option is used to ensure that imported Spatial Base Data, georeferenced Background Maps and GPS measurements do not lie outside the drawing area.
Coordinate System
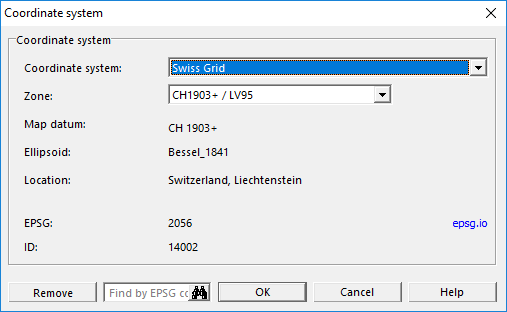
Click the Choose button to define a coordinate system. The Coordinate System dialog appears.
Choose the desired coordinate system. OCAD supports a lot of coordinate systems.
Click here to learn more about Scale, Coordinat System and Georeferencing.
Create the Base Map for the Field Work
Before you go mapping into the terrain, you should try to create the best possible base map. The more you invest in your base map, the faster and more accurate your mapping will be. In OCAD you can import spatial data, old orienteering maps, derive own base maps with LiDAR data and combine them.
Raster Base Maps
Typically, the orthophotos and topographic maps for orienteering maps are delivered as raster files. OCAD 2018 supports, among others, the most common used raster files: JPG, TIFF and PNG.
Orthophotos and topographic maps are mostly georeferenced. Raster files are georeferenced, when the pixels are referenced with the coordinates. Normally the georeferencing data is saved in a world file. The world file has the same file name as the raster file, but with another file extension: JPG → JGW, TIFF → TFW, PNG → PGW.
Open Georeferenced Raster Base Map as Background Map
Click to Background Map->Open
If there's not yet a coordinate system and offset, the Background Map (Georeferenced) dialog appears and shows the georeferencing of the selected background map.
Click OK.
Open not Georeferenced Raster Base Map as a Background Map
Click to Background Map->Open
It the seleced file is not georeferenced, you need to enter a resolution for the background map (if a raster map is loaded) and click the OK button.
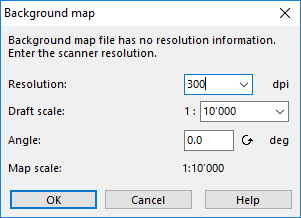
The background map is displayed at the center of the current drawing area. The raster map (background map) now needs to be adjusted with the map (Adjust a Background Map). In other words, it needs to be referenced with the map coordinate system.

![]() We recommend you to print the grid on the base map. Thereby you can adjust your scanned base map easier.
In the dialog File->Print select Print screen grid and choose the Grid color.
We recommend you to print the grid on the base map. Thereby you can adjust your scanned base map easier.
In the dialog File->Print select Print screen grid and choose the Grid color.
Preparation of LiDAR Data
LiDAR data is often a base for orienteering maps and highly recommended to use if available. LiDAR data is available as a point cloud in the las/laz file format. With LiDAR data, you can easily get lot of information about the terrain and the vegetation, which will make mapping much faster and more accurate.
For this purpose, there's an extra tutorial about Using Airborne Laserscanning Data for Orienteering Base Map Generation There you will learn, how to proceed LiDAR data in OCAD and how to use them when drawing orienteering maps..
Import Vector Data
Vector data can also be used to create the base map. The advantage is that vector data contain point, line, area and text objects which are directly converted to map objects during the import into OCAD. It saves a lot of time because especially in urban surroundings many map objects can be created automatically instead of being digitized manually. Governmental data is generally available as DXF or Shape files. OCAD can also import other vector data formats like PDF, AI, SVG or OSM (Open Street Map).
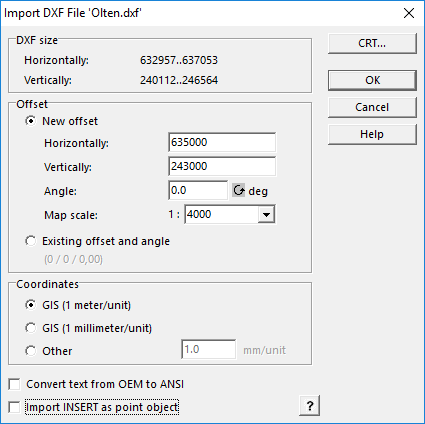
- Go to File->Import
- Choose an importable file, e.g. a dxf-file.
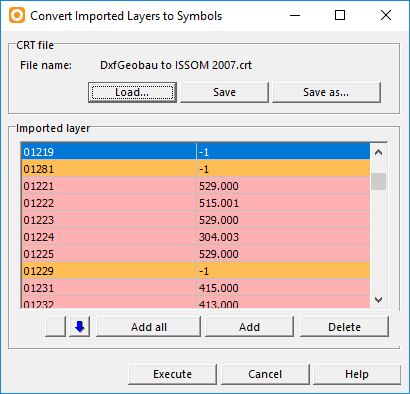
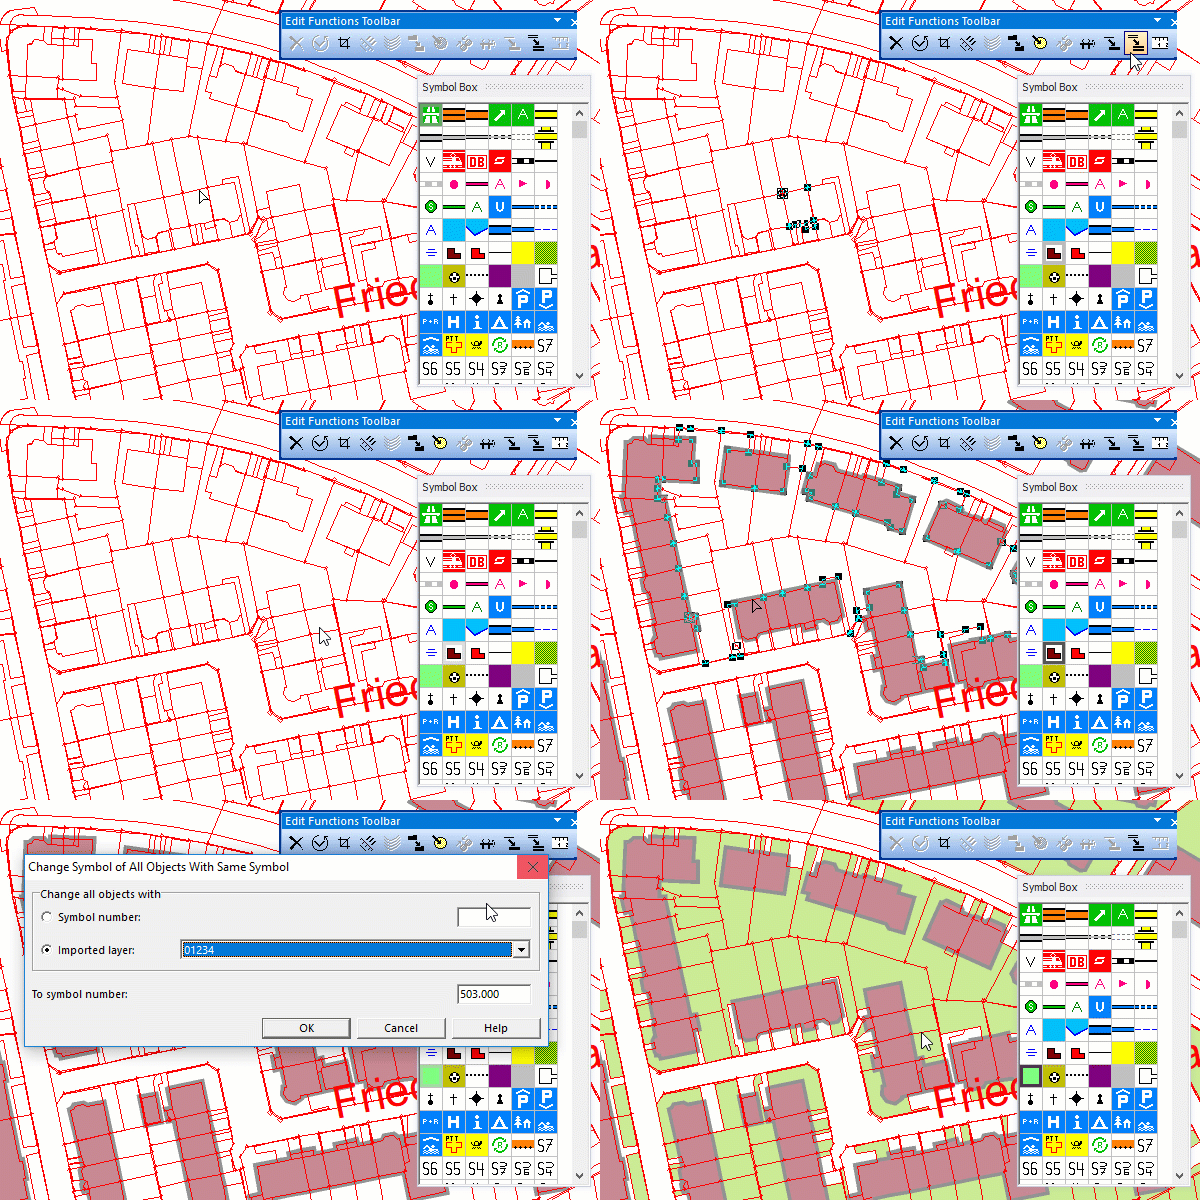
- The vector data is shown as Unsymbolized objects in the drawing area. You can symbolize the objects automatically:
- The map now shows all objects with the assigned symbols.
![]() You can also Convert the imported Layers manually.
You can also Convert the imported Layers manually.
Revision of an Existing Orienteering Map
If you use an old orienteering map as a base map for the revision, you have to consider following points:
- Control if the scale is proper.
- Check the declination.
- Correct the symbol set and match it to the current international specification.
- Convert freehand lines into curves.
- Delete disturbing objects. The base map shouldn’t contain any dark area objects.
The preparation of an existing OCAD file for a revision needs experience. It is recommended to consult an experienced map drawer or a map consultant.
![]() If your map is not georeferenced or no LiDAR/cadastral data has been used before, we recommend
you to start your new map from scratch. As you could see in the chapters above, high quality base
maps can be produced in a minute, where all objects are at the right place.
If your map is not georeferenced or no LiDAR/cadastral data has been used before, we recommend
you to start your new map from scratch. As you could see in the chapters above, high quality base
maps can be produced in a minute, where all objects are at the right place.
Mapping in the terrain
Nowadays, with the right background material and equipment, mapping in the terrain is not about the right place of the object - it is about which objects should be on the map. This process is called generalisation and is done differently by every cartographer.
In case your background material isn't that great, you can get help of a GPS device or a Laser Rangefinder. In this case, mapping with a Tablet PC can make sense. OCAD supports real-time GPS so you can see you current position on the tablet. Furthermore, switching between differnt background maps is easy.
However, most cartographer still prefer to map with pen and paper. This way, you are faster in the field and can make the final drawing at home, where you work more efficiently and weather independent.
In the example above, the following color were used:
Black: Buildings, streets, paved area, rocks, stones
Red: Terrain, canopies/passages, open land
Blue: Water, wells, walls, fences
Green: Vegetation, hedges, trees
Prepare your field work for digitizing
Scan Field Work, Open it as a Background Map and Adjust
When you are back from mapping...
- Scan your field work and save it in a raster format (JPG, TIFF or PNG).
- Background Map->Open
- Adjust your Background Map (F9)
Background Map Options
Go to Background Map -> Manage
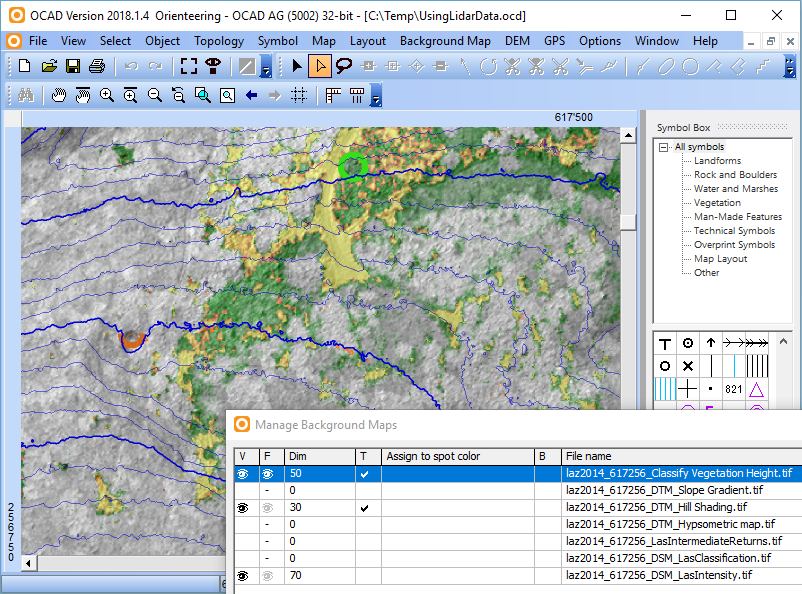
In the Manage Background Map dialog a table is displayed, in which all loaded background maps are listed.

- V (Visible): You can make a background map visible or hide it by clicking the corresponding cell in this column. An eye icon in this column means that the background map is visible.
 To hide all background maps temporary use the Hide All command in the Background Map menu.
- F (Visible in Background Favorites view mode): You can make a background map visible or hide it in the Background Favorites by clicking the corresponding cell in this column. An eye icon in this column means that the background map is visible in the Background Favorites.
- Dim: In this column you can enter a value in percentage to make the background map appear brighter, i.e. to dim it. 0% means the background map is displayed in its original colors. 100% means the background map appears completely white. Dimming is used to get a better distinction between the background map and the map.
- T (Transparent): If more than one background map is opened you can set them transparent so that both are visible. Activate this option by clicking the corresponding cell in this column.
![]() The order of the background maps can be changed with the arrow icons
The order of the background maps can be changed with the arrow icons ![]() or with drag and drop.
or with drag and drop.
Background Map Options
Choose the Hide All command in the Background Map menu or press the F10 key to hide all background maps temporarily or make them visible when they are hidden.
Draw an Object on the Map
To draw an object, click on the symbol in the symbol box first, then choose the drawing tool in the toolbar and finally draw the object in the drawing area.
Please read the Wiki Page Drawing an Object to learn more about it.
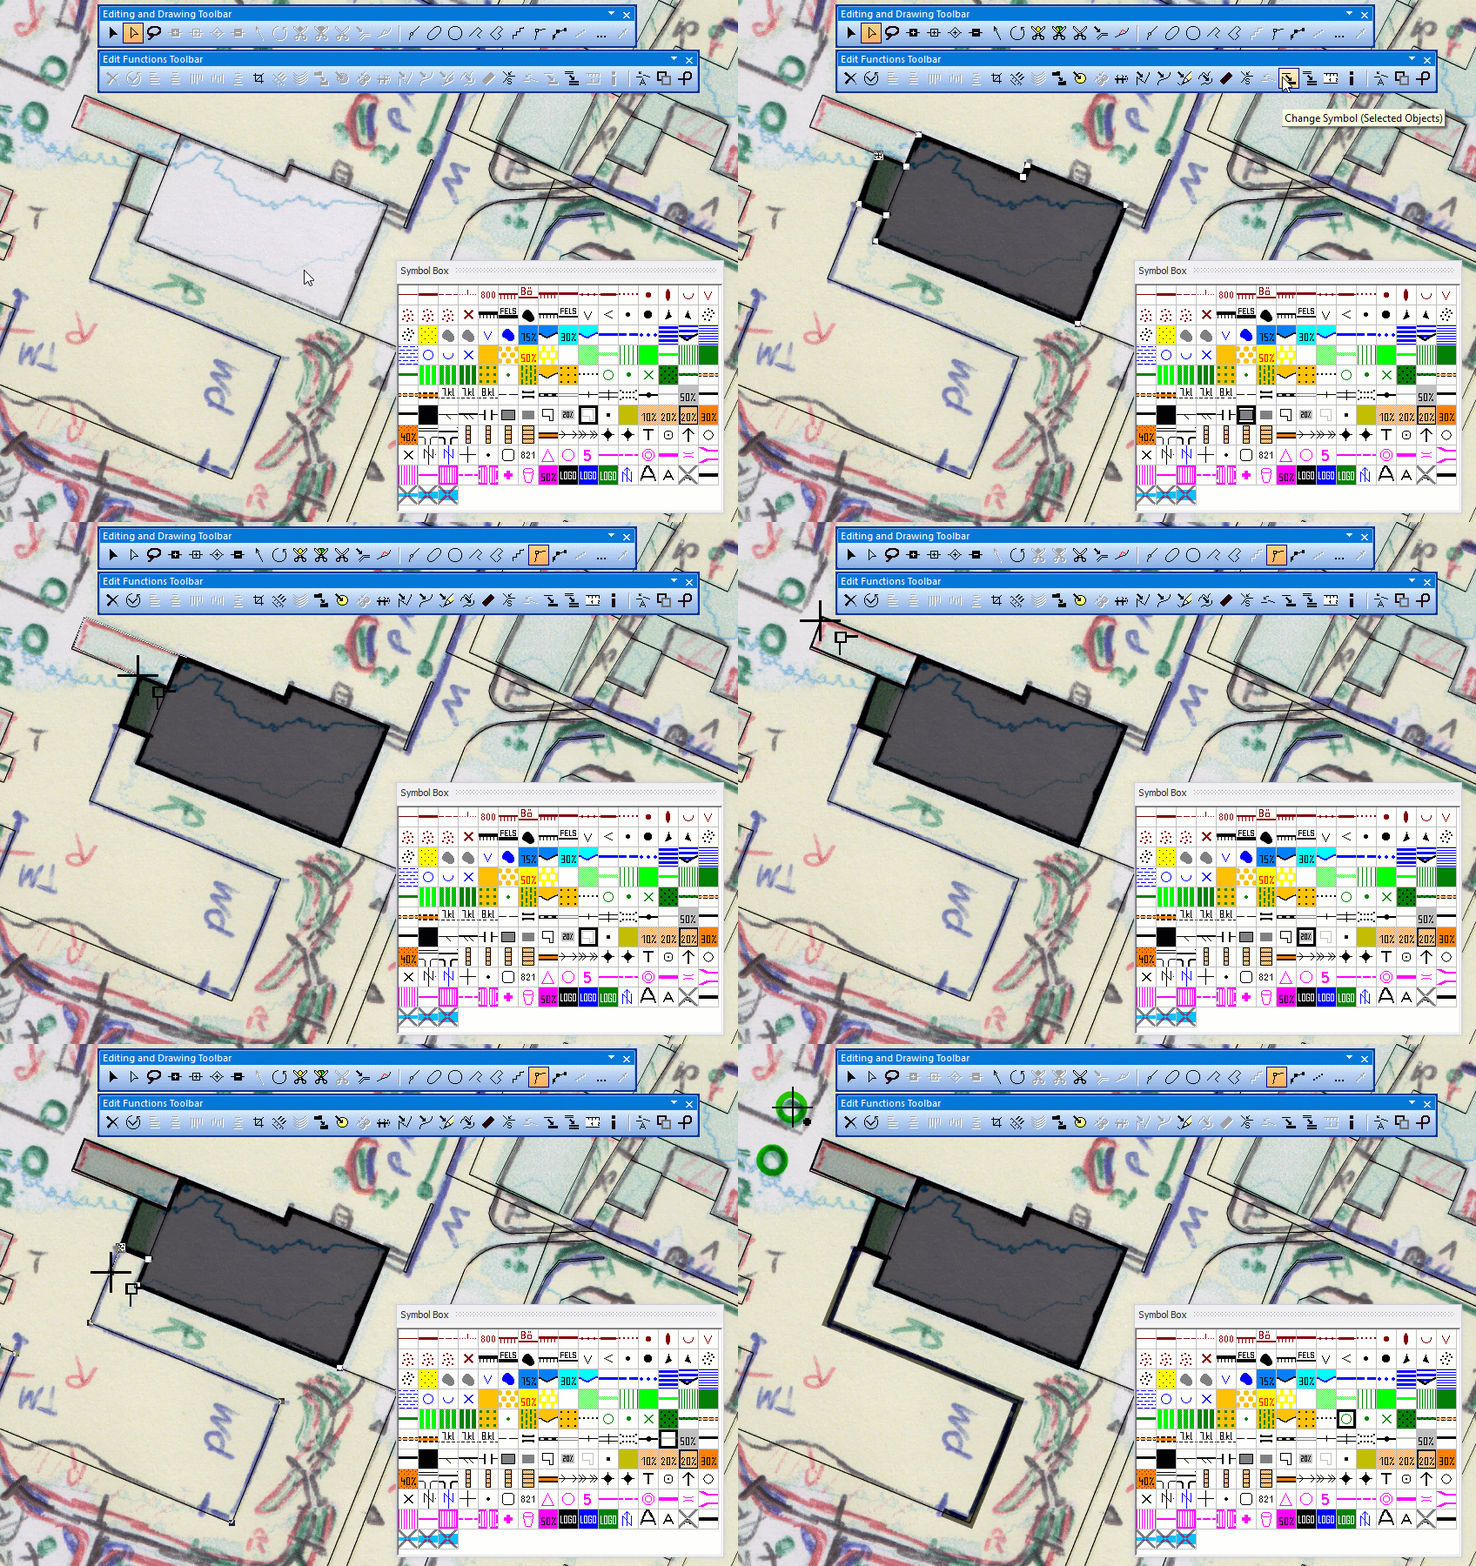
Edit Objects
To edit an object, there are many edit tools:
- Edit tools in the Edit and Drawing Toolbar
- Edit functions in the Edit Functions Toolbar
To edit an object, the object has to been selected:
Find more information on the Edit Object page.
Check Legibility of your Map
The term Generalisation was mentioned already above and deals with the question, which objects are important and should be on a map and which are not. The problem is seldom that there are too few objects on the map, but often are too many and too small objects on the map. This has to do with more accurate background maps, on which you see every detail.
Be also aware, that orienteering maps are no cadastral maps. Readability is much more important than position accuracy. You are allowed to cheat, e.g. make buildings smaller to emphasize a passage. Nobody will recognise.
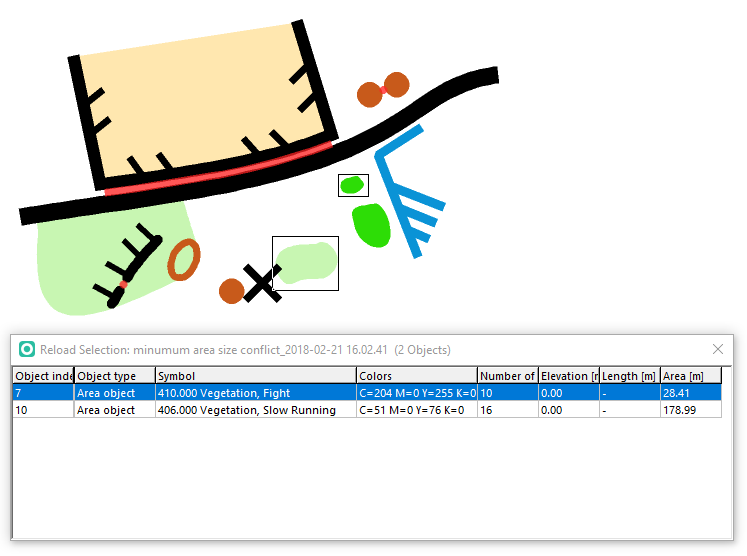
OCAD has a function called Check Legibility that helps you verifying your map.
Use this function to check minimum distances between objects, minimum length of line objects or minimum size of area objects according to ISOM 2017.
Colors and Symbols
Colors
In the Map -> Colors dialog you can manage the colors of the symbols. You shouldn’t change something in the list, when you don’t know what you are doing. The order of the colors in the color list regulates the overlaying: a color covers at the printing all the colors that are below.
The actual ISOM Symbol Sets of OCAD contains the latest CMYK color value. However, they may change from time to time. The latest CMYK color values can be found [here].
Symbols
Symbol Sets for Orienteering Maps
OCAD delivers many predefined Symbol Sets for Orienteering maps and are part of OCAD 2018. Choose one of the Symbol Set, when you start a new file File -> New. The latest ISOM (International Specification for Orienteering Maps) is ISOM 2017 for Forest Maps. If your map is still in an older ISOM standard, you can change the symbols to ISOM 2017 under Map -> Symbol Set Conversion.
For Sprint Maps the latest specification is only 2007 (ISSOM 2007). The symbol sets are also delivered for Ski and Bike orienteering.
Print and Export
Go to File>Print (or Ctrl+P) to print your map. Select printer, scale and extend. Read more on the Printing Maps page.
![]() Print your map in the intended scale after a while. Check if you can read all details. Remember to keep at least the minimum dimensions defined by the IOF. The Check Legibility function helps you with that. When working with 64x zoom level, you easily get too small and too many symbols on your map.
Print your map in the intended scale after a while. Check if you can read all details. Remember to keep at least the minimum dimensions defined by the IOF. The Check Legibility function helps you with that. When working with 64x zoom level, you easily get too small and too many symbols on your map.
Export Files
Go to File>Export (or Ctrl+E) to export your map. Set output file, quality and extend. Read more on the Export Files page.
![]() You can't export a PDF, when you are in the Draft View mode. Change to the Normal mode.
You can't export a PDF, when you are in the Draft View mode. Change to the Normal mode.
![]() Due to color display, we recommend you to always create a PDF first out of OCAD and print this PDF afterwards. OCAD works with CMYK Colors and they will only be displayed correctly this way. What you see on your screen are RGB-Colors from the Windows Graphics Device Interface (GDI). When you print maps directly out of OCAD, the Windows GDI converts the CMYK values first in RGB values and your printer driver back to CMYK values. This way it may come to changes in the color values.
Due to color display, we recommend you to always create a PDF first out of OCAD and print this PDF afterwards. OCAD works with CMYK Colors and they will only be displayed correctly this way. What you see on your screen are RGB-Colors from the Windows Graphics Device Interface (GDI). When you print maps directly out of OCAD, the Windows GDI converts the CMYK values first in RGB values and your printer driver back to CMYK values. This way it may come to changes in the color values.
